UNITED STATES
SECURITIES AND EXCHANGE COMMISSION
WASHINGTON, D.C. 20549
FORM 6-K
REPORT OF FOREIGN PRIVATE ISSUER
PURSUANT TO RULE 13a-16 OR 15d-16 UNDER THE
SECURITIES EXCHANGE ACT OF 1934
For the month of May 2025
Commission File Number: 001-41247
SunCar Technology Group Inc.
(Translation of registrant’s name into English)
c/o Shanghai Feiyou Trading Co., Ltd.
Suite 209, No. 656 Lingshi Road
Jing’an District, Shanghai, 200072
People’s Republic of China
Tel: (86) 138-1779-6110
(Address of principal executive office)
Indicate by check mark whether the registrant files or will file annual reports under cover of Form 20-F or Form 40-F:
Form 20-F ☒ Form 40-F ☐
Financial Statements and Exhibits
Exhibits.
| Number | ||
| 99.1 | A copy of the registrant’s Investor Presentation. |
1
SIGNATURES
Pursuant to the requirements of the Securities Exchange Act of 1934, the registrant has duly caused this report to be signed on its behalf by the undersigned, thereunto duly authorized.
| SunCar Technology Group Inc. | ||
| May 30, 2025 | By: | /s/ Zaichang Ye |
| Name: | Zaichang Ye | |
| Title: | Chief Executive Officer | |
| (Principal Executive Officer) | ||
2
Exhibit 99.1
1 Leading Technology Platform For B2B Auto eInsurance & Services Investor Presentation May 2025
2 This investor presentation may contain forward - looking statements within the meaning of Section 21 E of the Securities Exchange Act of 1934 , as amended, and Section 27 A of the Securities Act of 1933 , as amended . All statements other than statements of historical fact are “forward - looking statements” for purposes of this investor presentation . In some cases, you can identify forward - looking statements by terminology such as “believe,” “expect,”, “anticipate”, “may”, “would”, “strategy,” “estimates”, “will,”, “project”, “potential”, and similar expressions and variations thereof . Forward - looking statements are based largely on our current expectations and projections about future events and trends that we believe may affect our financial condition, results of operations, business strategy, short - term and long - term business operations and objectives and financial needs . These forward - looking statements are subject to a number of risks, uncertainties and assumptions, including those described in the “Risk Factors” section of our Annual Report on Form 20 - F (the “Annual Report”) . Additional risks specific to SunCar include : regulatory changes by Chinese regulators that could materially restrict foreign investment or affect our business operations, including insurance commission rates ; customer concentration risk with enterprise clients including major banks and insurance companies ; integration risks associated with DeepSeek AI technology implementation ; and exposure to China's electric vehicle market cyclicality which could impact our fastest - growing revenue segment . Moreover, we operate in a competitive and rapidly changing environment, and new risks emerge from time to time . It is not possible for our management to predict all risks, nor can we assess the impact of all factors on our business . In light of these risks, uncertainties and assumptions, actual results could differ materially and adversely from those anticipated in the forward - looking statements . These statements reflect our current views as of the date of this investor presentation with respect to future events and are based on assumptions and subject to risks and uncertainties . All written and verbal forward - looking statements attributable to us or any person acting on our behalf are expressly qualified in their entirety by the cautionary statements contained or referred to in this disclaimer and the Annual Report . We caution investors not to rely too heavily on the forward - looking statements we make or that are made on our behalf . We undertake no obligation to update publicly any forward - looking statements for any reason after the date of this investor presentation to conform these statements to actual results or to changes in our expectations, except as required by law . Non - GAAP Disclaimer : This presentation includes “Non - GAAP financial measures” as that term is defined in Regulation G . Further discussion regarding our use of Non - GAAP financial measures, as well as the most directly comparable GAAP (accounting principles generally accepted in the United States) financial measures and information reconciling these Non - GAAP financial measures to our financial results prepared in accordance with GAAP, are included at the end of this presentation . These non - GAAP measures are presented as supplemental information and reconciled to the appropriate GAAP measures at the end of this presentation . The non - GAAP financial measures presented may be determined or calculated differently by other companies . The non - GAAP financial information presented should not be unduly relied upon . Cautionary Statement Concerning Forward Looking Statements
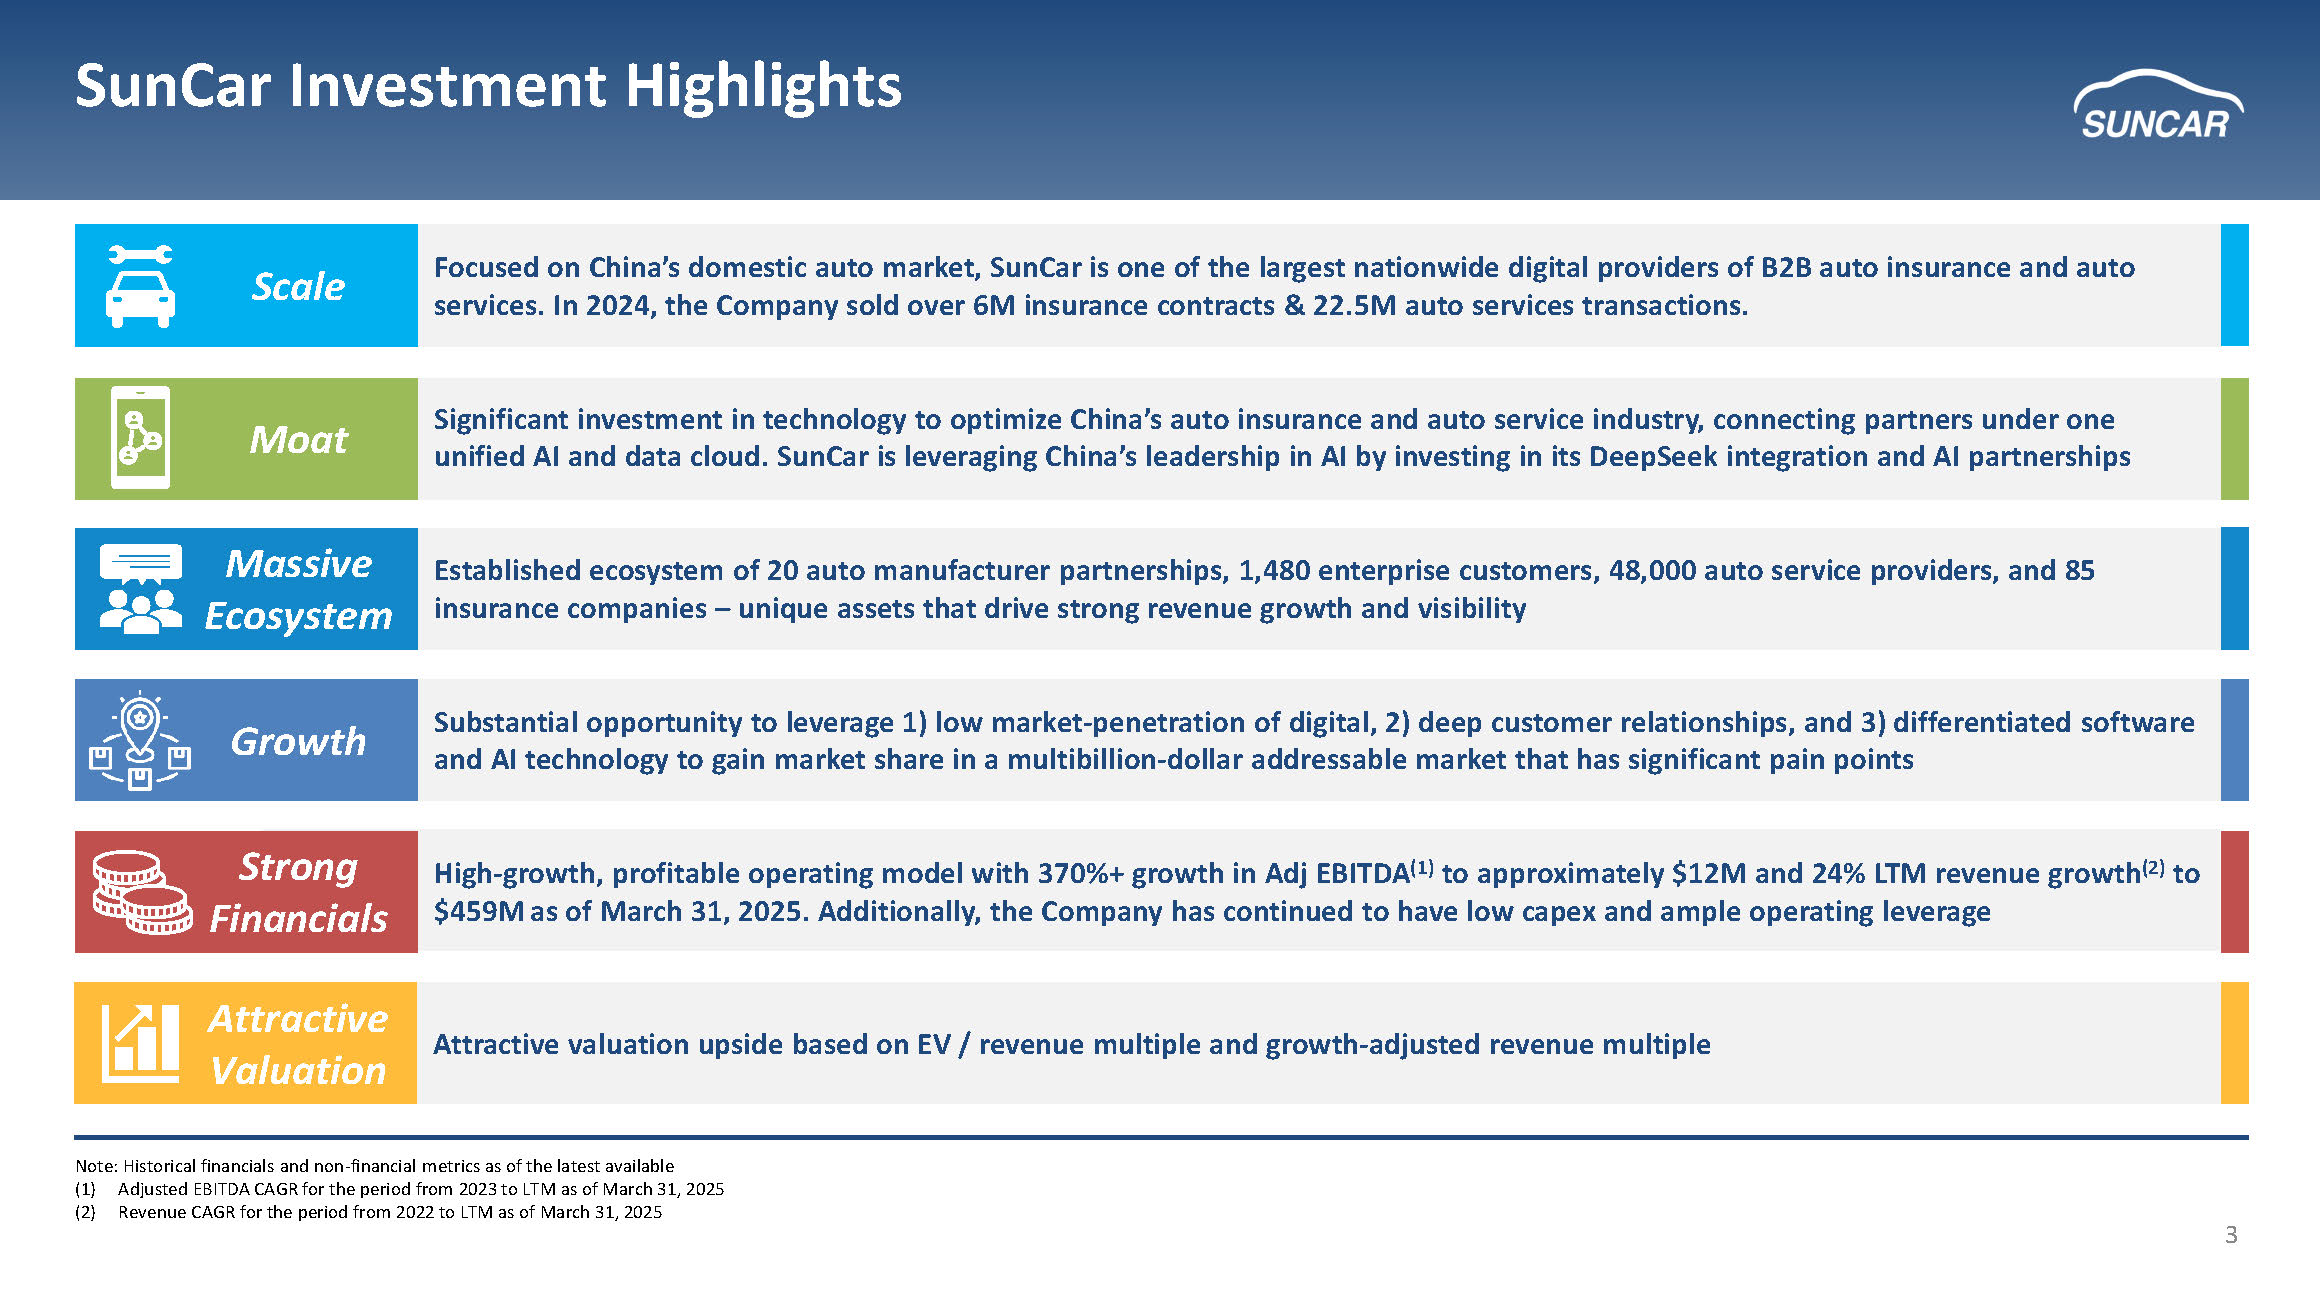
3 SunCar Investment Highlights Focused on China’s domestic auto market, SunCar is one of the largest nationwide digital providers of B2B auto insurance and aut o services. In 2024, the Company sold over 6M insurance contracts & 22.5M a uto services transactions. Scale Significant investment in technology to optimize China’s auto insurance and auto service industry, connecting partners under one unified AI and data cloud. SunCar is leveraging China’s leadership in AI by investing in its DeepSeek integration and AI part ner ships Moat Established ecosystem of 20 auto manufacturer partnerships, 1,480 enterprise customers, 48,000 auto service providers, and 85 insurance companies – unique assets that drive strong revenue growth and visibility Massive Ecosystem Substantial opportunity to leverage 1) low market - penetration of digital, 2) deep customer relationships, and 3) differentiated software and AI technology to gain market share in a multibillion - dollar addressable market that has significant pain points Growth Strong Financials Attractive valuation upside based on EV / revenue multiple and growth - adjusted revenue multiple Attractive Valuation Note: Historical financials and non - financial metrics as of the latest available (1) Adjusted EBITDA CAGR for the period from 2023 to LTM as of March 31, 2025 (2) Revenue CAGR for the period from 2022 to LTM as of March 31, 2025 High - growth, profitable operating model with 370 %+ growth in Adj EBITDA (1) to approximately $12M and 24% LTM revenue growth (2) to $459M as of March 31, 2025 . Additionally, the Company has continued to have low capex and ample operating leverage
4 Company Profile
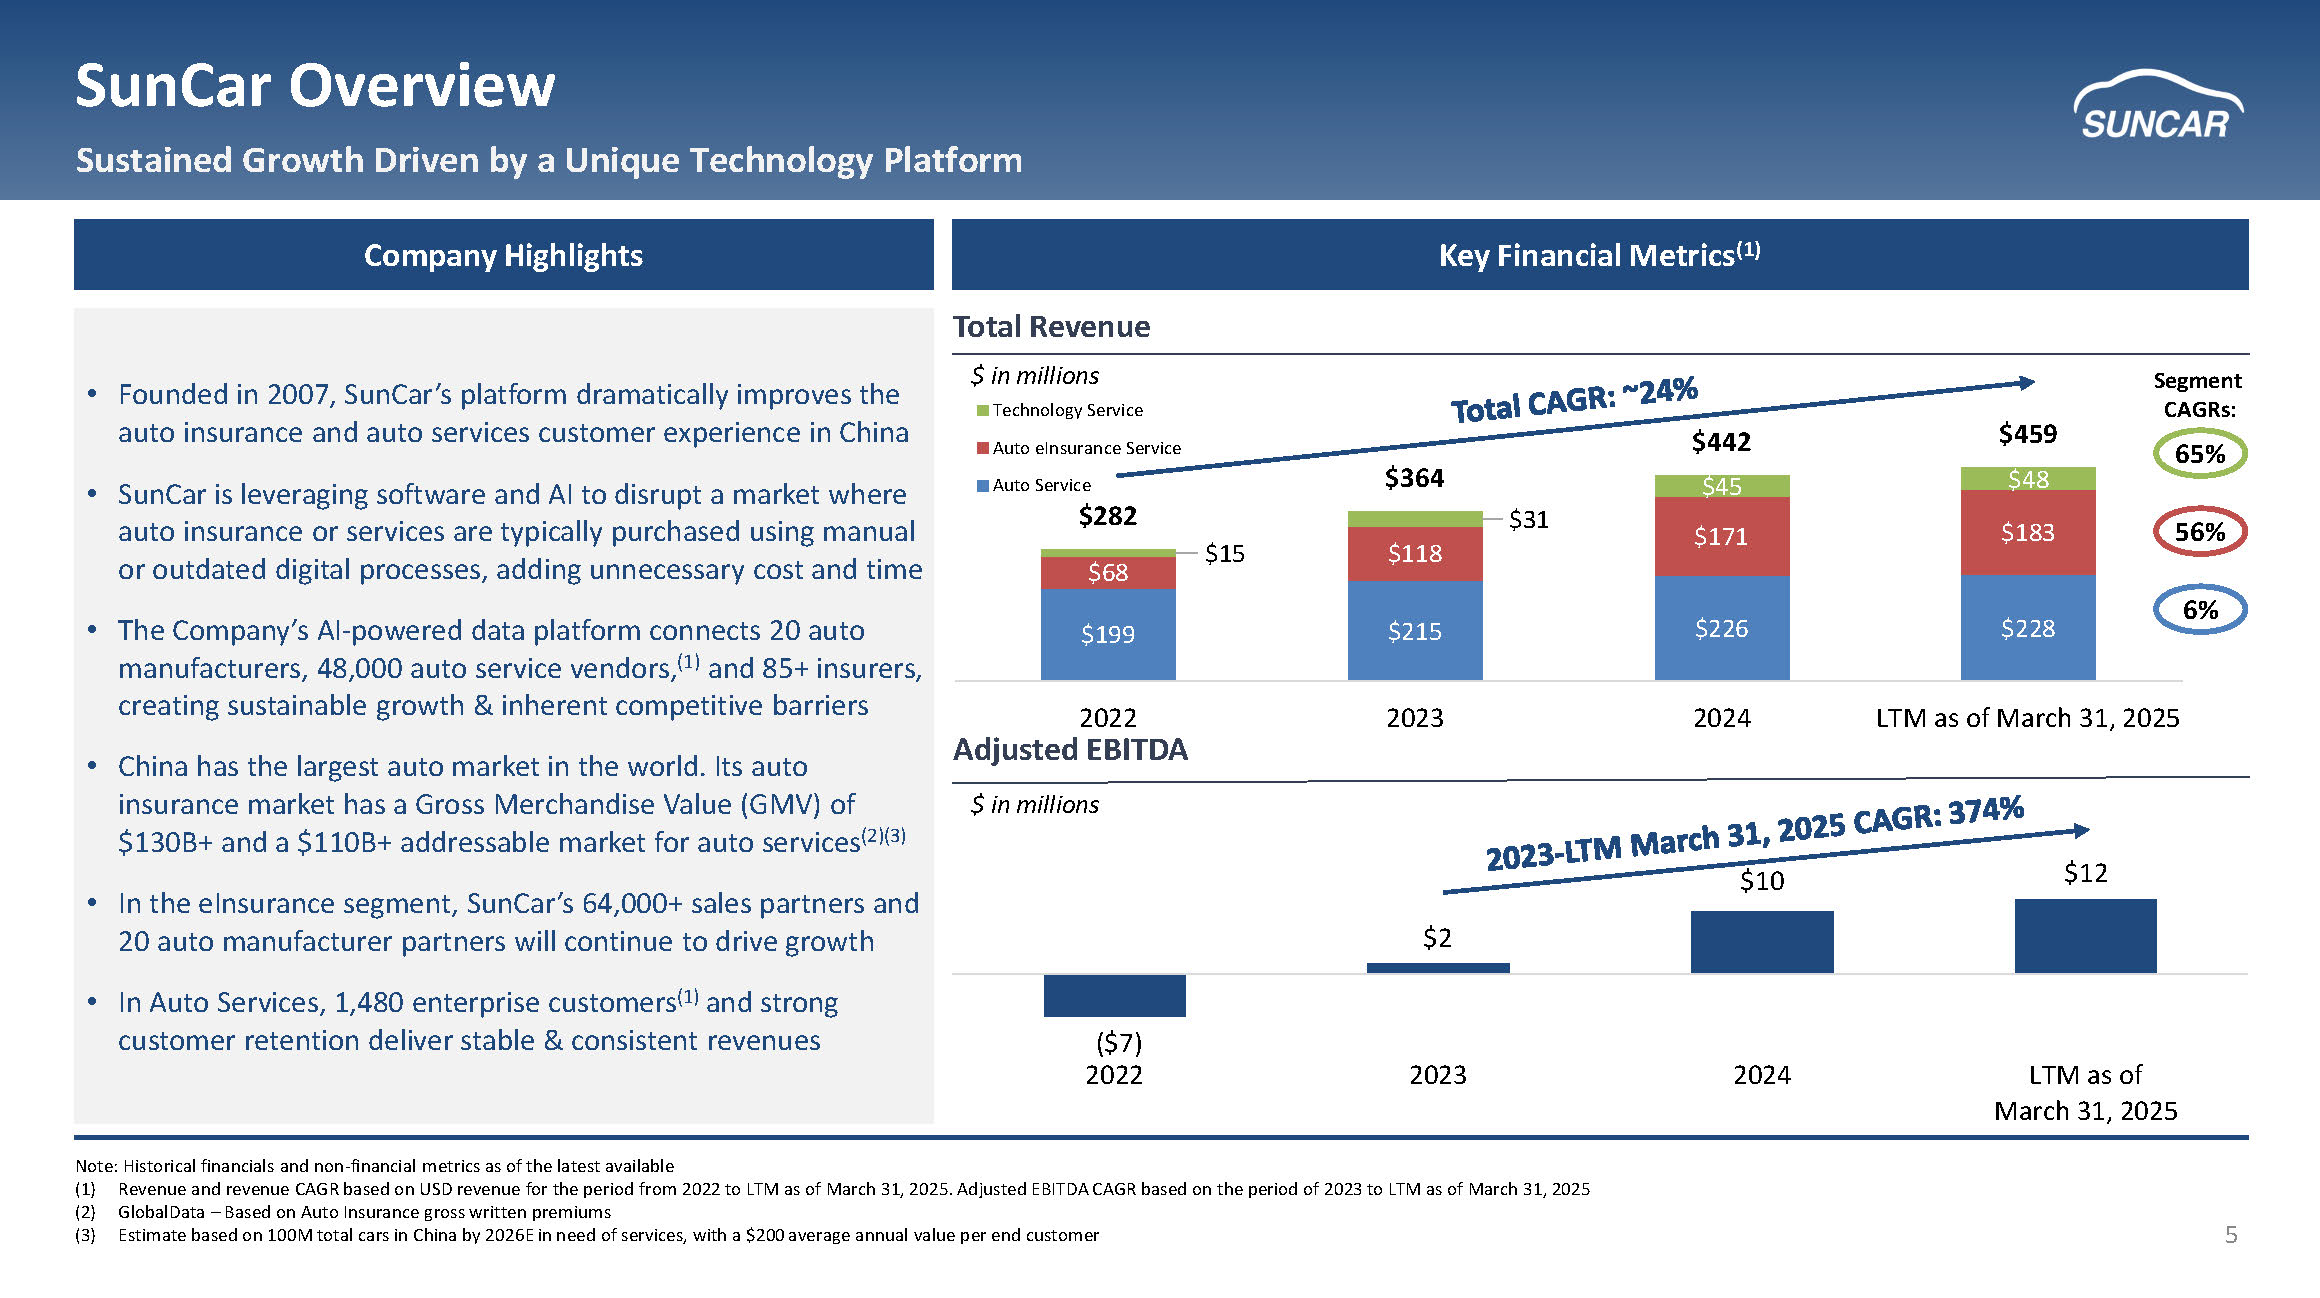
5 SunCar Overview Sustained Growth Driven by a Unique Technology Platform Company Highlights Key Financial Metrics (1) Adjusted EBITDA Total Revenue • Founded in 2007, SunCar ’s platform dramatically improves the auto insurance and auto services customer experience in China • SunCar is leveraging software and AI to disrupt a market where auto insurance or services are typically purchased using manual or outdated digital processes, adding unnecessary cost and time • The Company’s AI - powered data platform connects 20 auto manufacturers, 48,000 auto service vendors, (1) and 85+ insurers, creating sustainable growth & inherent competitive barriers • China has the largest auto market in the world. Its auto insurance market has a Gross Merchandise Value (GMV) of $130B+ and a $110B+ addressable market for auto s ervices (2)(3) • In the eInsurance segment, SunCar’s 64,000+ sales partners and 20 auto manufacturer partners will continue to drive growth • In Auto Services, 1,480 enterprise customers (1) and strong customer retention de liver stable & consistent revenues $ in millions $ in millions Note: Historical financials and non - financial metrics as of the latest available (1) Revenue and revenue CAGR based on USD revenue for the period from 2022 to LTM as of March 31, 2025. Adjusted EBITDA CAGR base d o n the period of 2023 to LTM as of March 31, 2025 (2) GlobalData – Based on Auto Insurance gross written premiums (3) Estimate based on 100M total cars in China by 2026E in need of services, with a $200 average annual value per end customer ($7) $2 $10 $12 2022 2023 2024 LTM as of March 31, 2025 $199 $215 $226 $228 $68 $118 $171 $183 $15 $31 $45 $48 $282 $364 $442 $459 2022 2023 2024 LTM as of March 31, 2025 Technology Service Auto eInsurance Service Auto Service Segment CAGRs: 65% 56% 6%
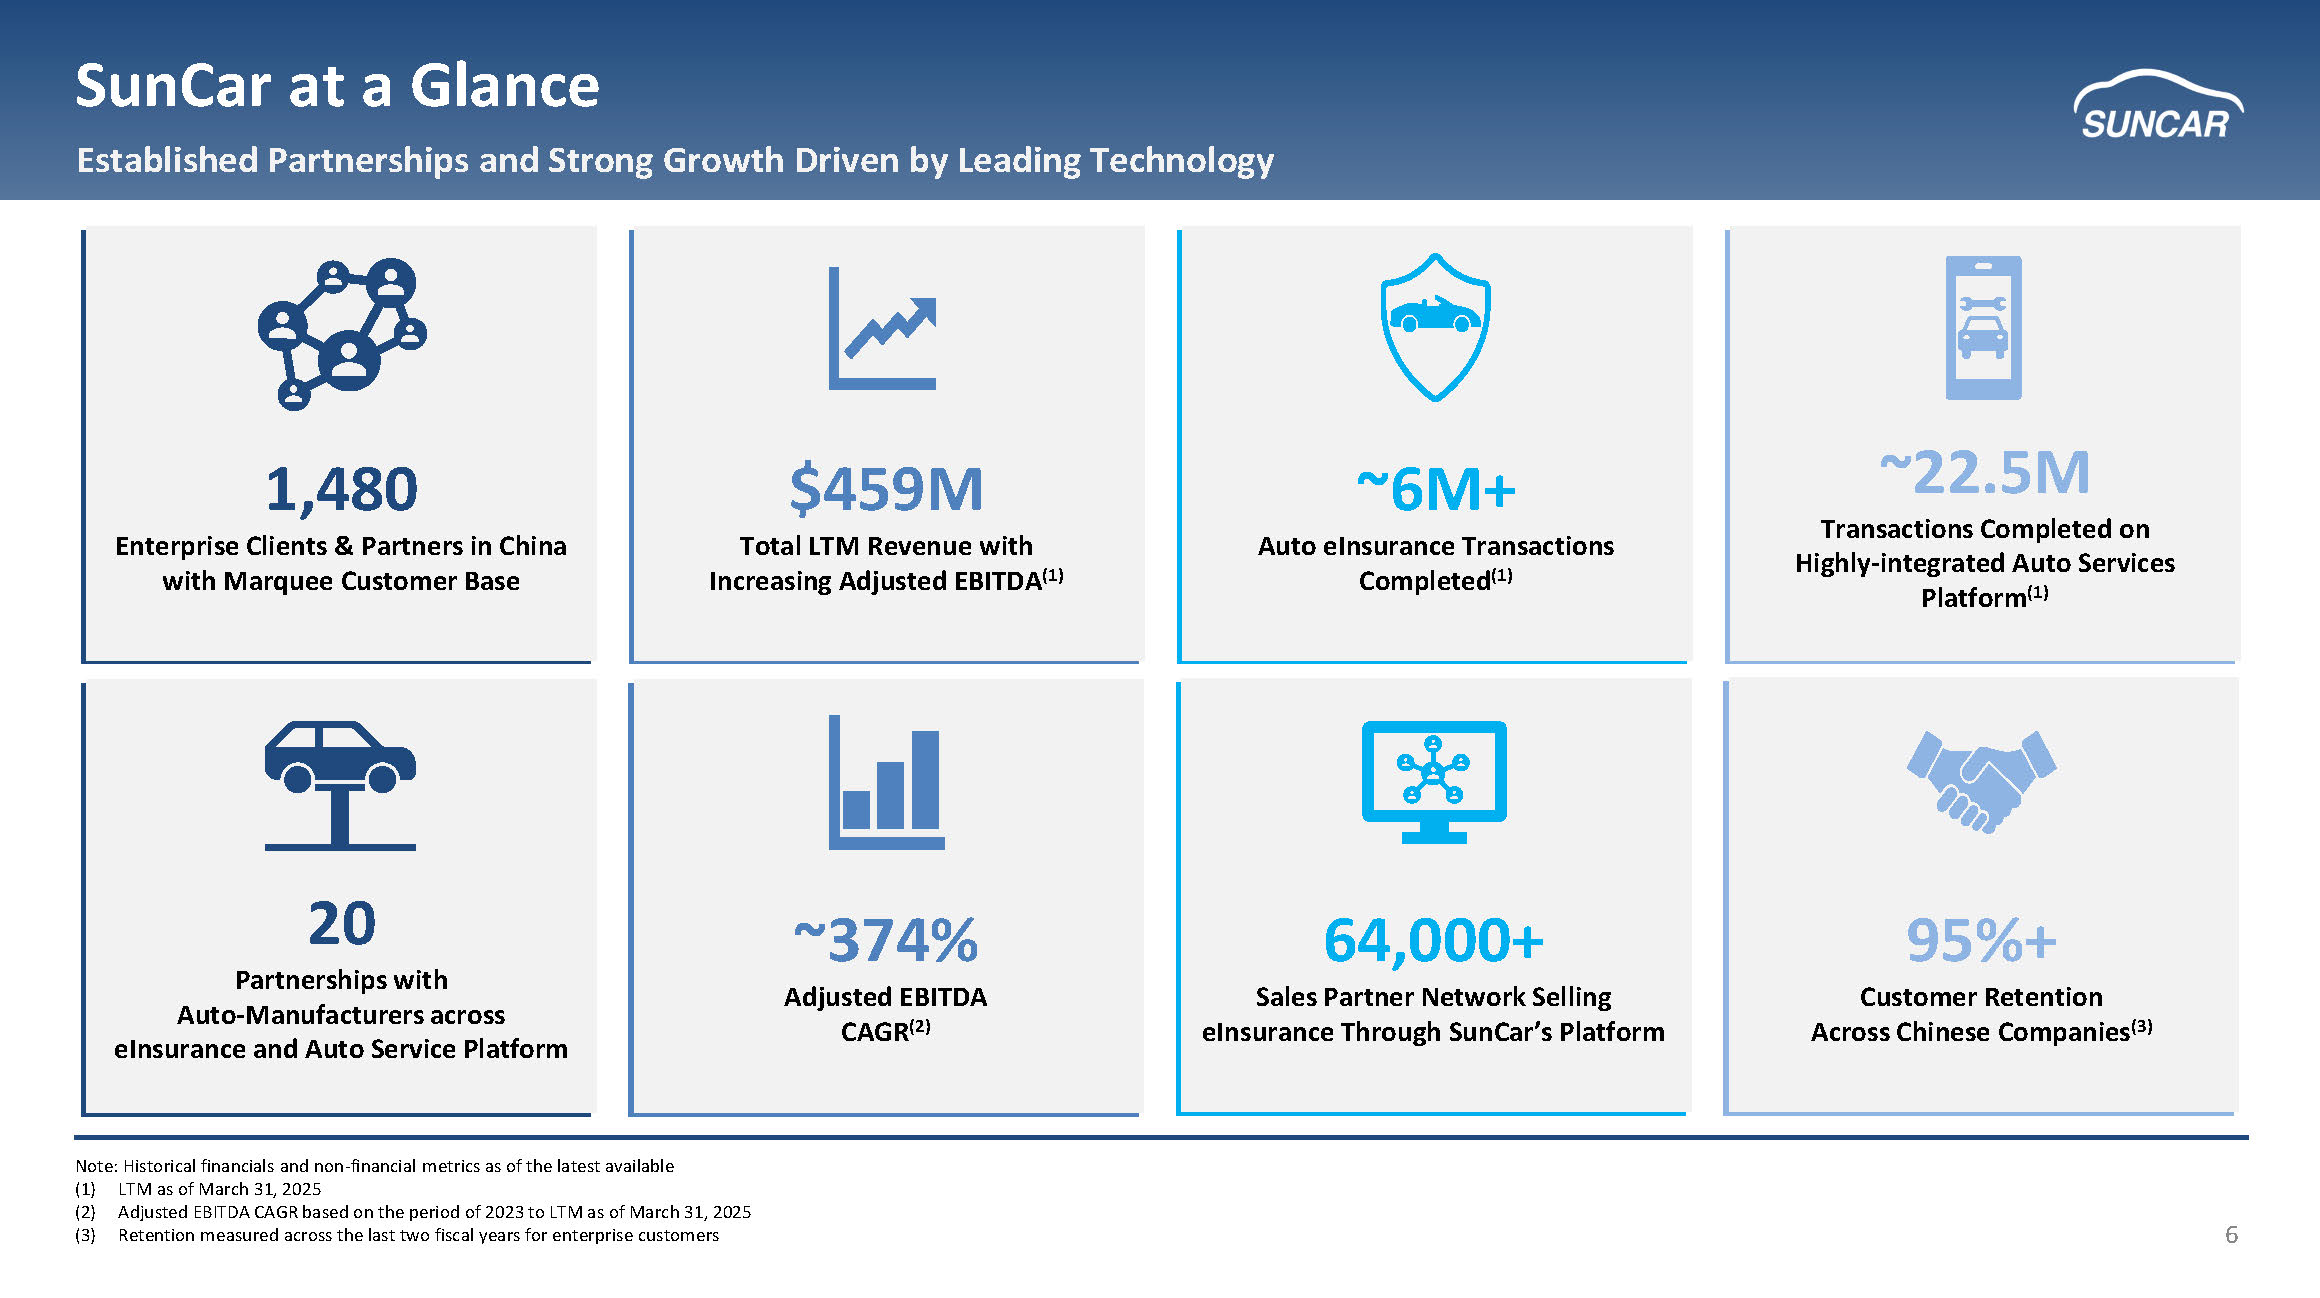
6 SunCar at a Glance Established Partnerships and Strong Growth Driven by Leading Technology 1,48 0 Enterprise Clients & Partners in China with Marquee Customer Base $459M Total LTM Revenue with Increasing Adjusted EBITDA (1) ~6M+ Auto e Insurance Transactions Completed (1 ) ▪ 4 95%+ Customer Retention Across Chinese Companies (3) 64,000+ Sales Partner Network Selling eInsurance Through SunCar’s Platform ~ 22.5 M Transactions Completed on Highly - integrated Auto Services Platform ( 1 ) 20 Partnerships with Auto - Manufacturers across eInsurance and Auto Service Platform Note: Historical financials and non - financial metrics as of the latest available (1) LTM as of March 31, 2025 (2) Adjusted EBITDA CAGR based on the period of 2023 to LTM as of March 31, 2025 (3) Retention measured across the last two fiscal years for enterprise customers ~374% Adjusted EBITDA CAGR (2)
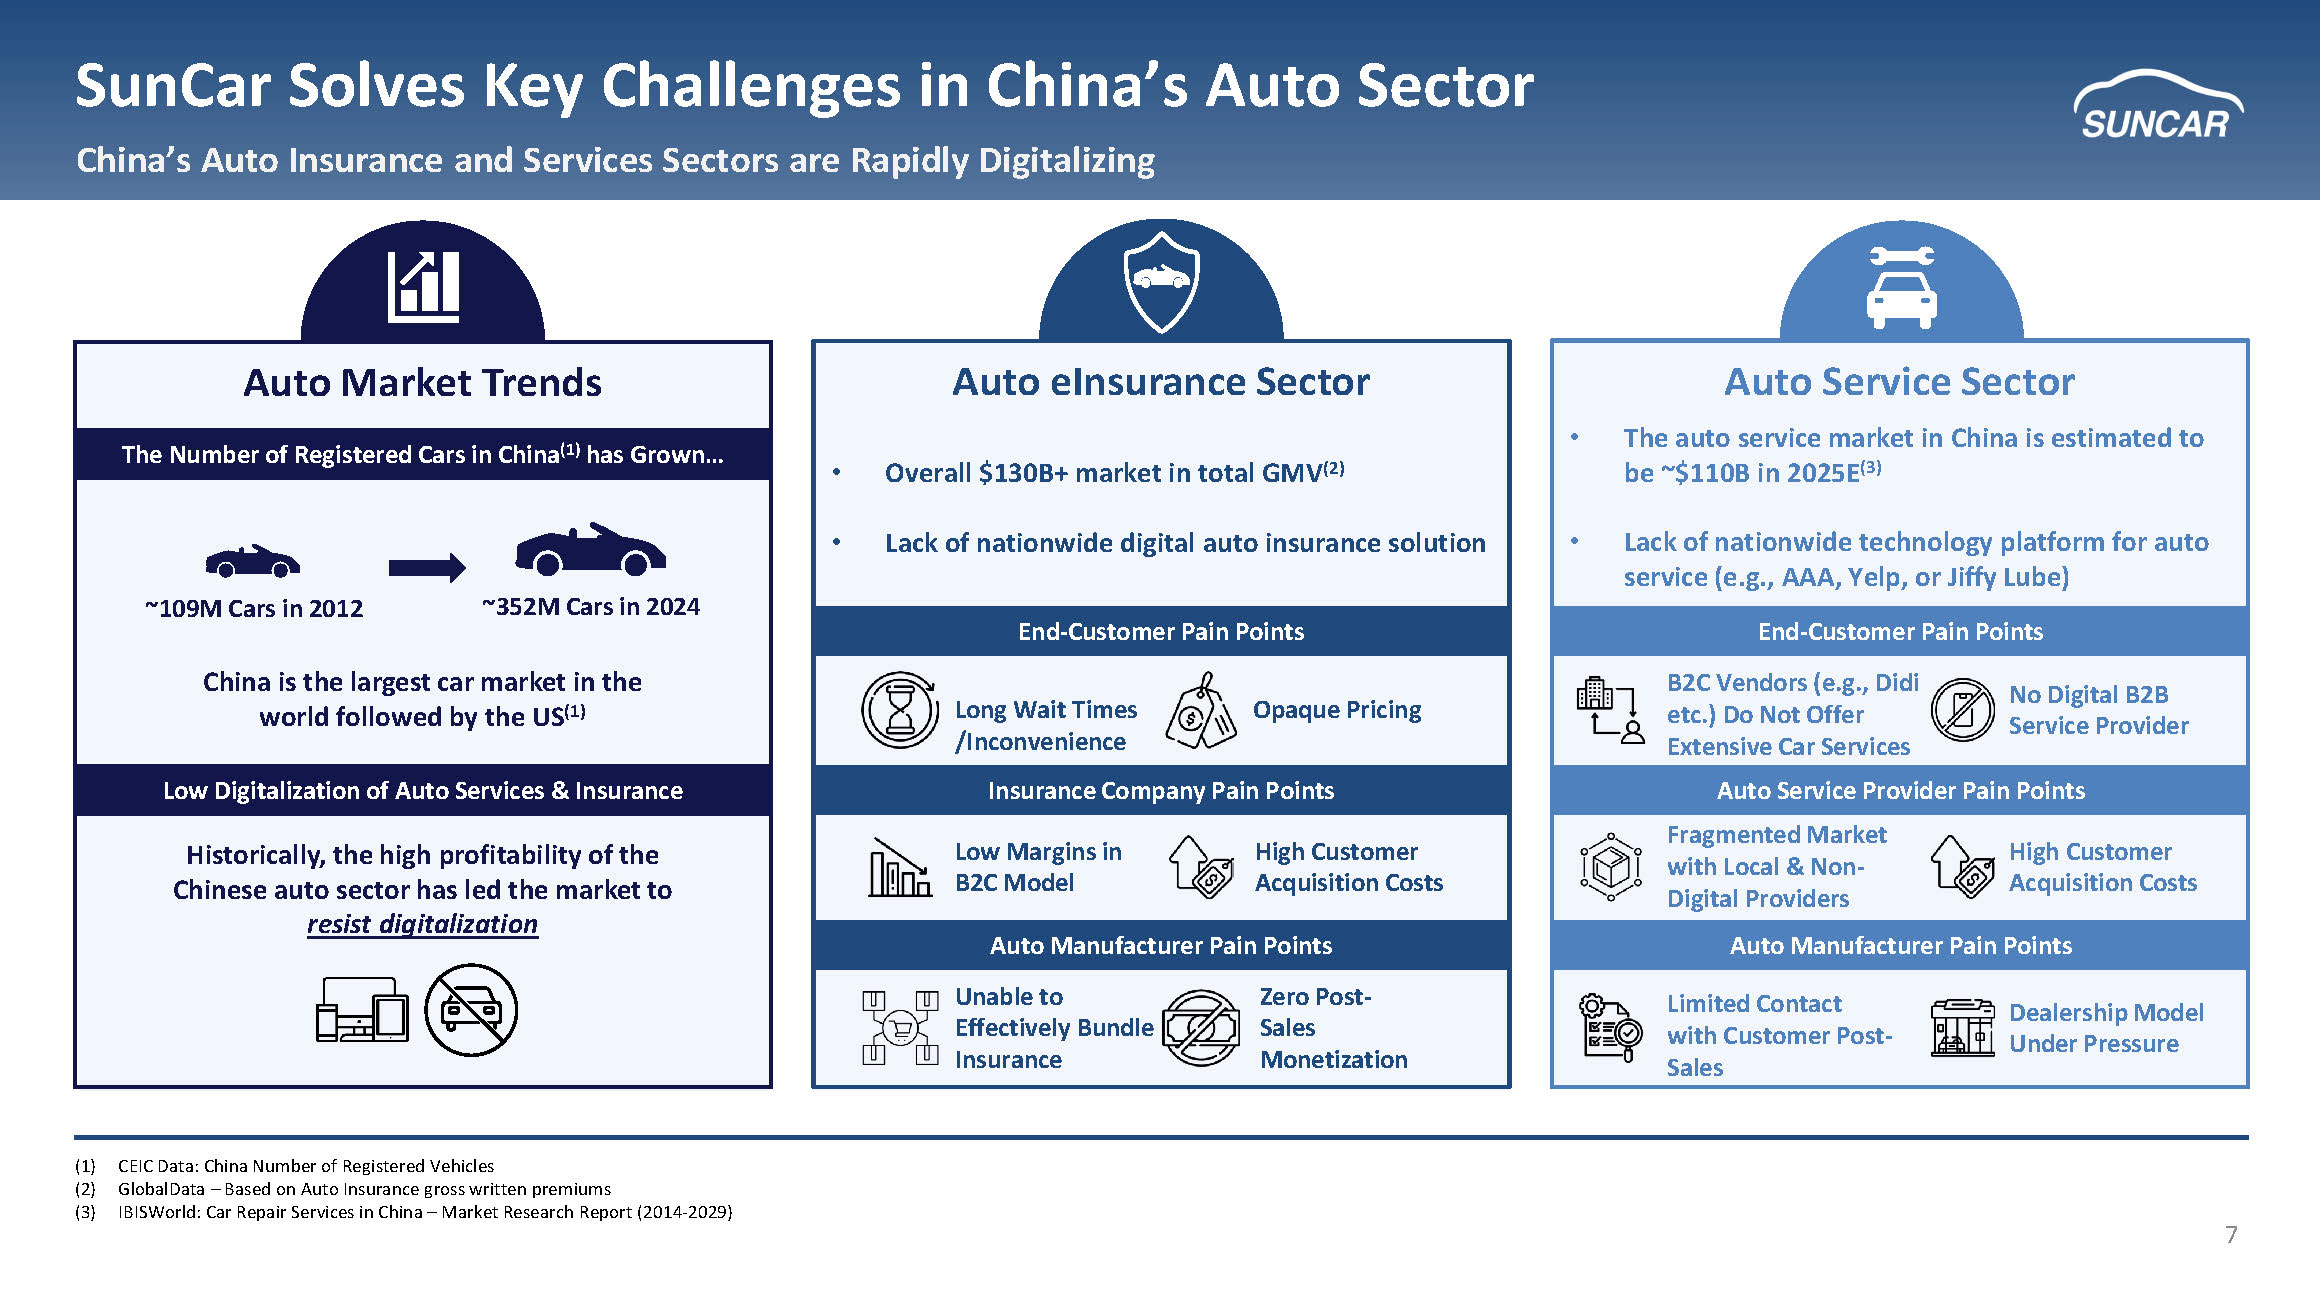
7 SunCar Solves Key Challenges in China’s Auto Sector China’s Auto Insurance and Services Sectors are Rapidly Digitalizing Auto Service Provider Pain Points End - Customer Pain Points Auto Manufacturer Pain Points Limited Contact with Customer Post - Sales Fragmented Market with Local & Non - Digital Providers High Customer Acquisition Costs B2C Vendors (e.g., Didi etc.) Do Not Offer Extensive Car Services No Digital B2B Service Provider Auto Service Sector Auto Manufacturer Pain Points Auto eInsurance Sector Low Margins in B2C Model High Customer Acquisition Costs Unable to Effectively Bundle Insurance End - Customer Pain Points Insurance Company Pain Points Long Wait Times /Inconvenience Opaque Pricing Auto Market Trends Historically, the high profitability of the Chinese auto sector has led the market to resist digitalization The Number of Registered Cars in China (1) has Grown… ~109M Cars in 2012 ~352M Cars in 2024 China is the largest car market in the world followed by the US (1) Low Digitalization of Auto Services & Insurance • Overall $130B+ market in total GMV (2) • Lack of nationwide digital auto insurance solution • The auto service market in China is estimated to be ~$110B in 2025E (3) • Lack of nationwide technology platform for auto service (e.g., AAA, Yelp, or Jiffy Lube) Zero Post - Sales Monetization Dealership Model Under Pressure (1) CEIC Data: China Number of Registered Vehicles (2) GlobalData – Based on Auto Insurance gross written premiums (3) IBISWorld: Car Repair Services in China – Market Research Report (2014 - 2029)
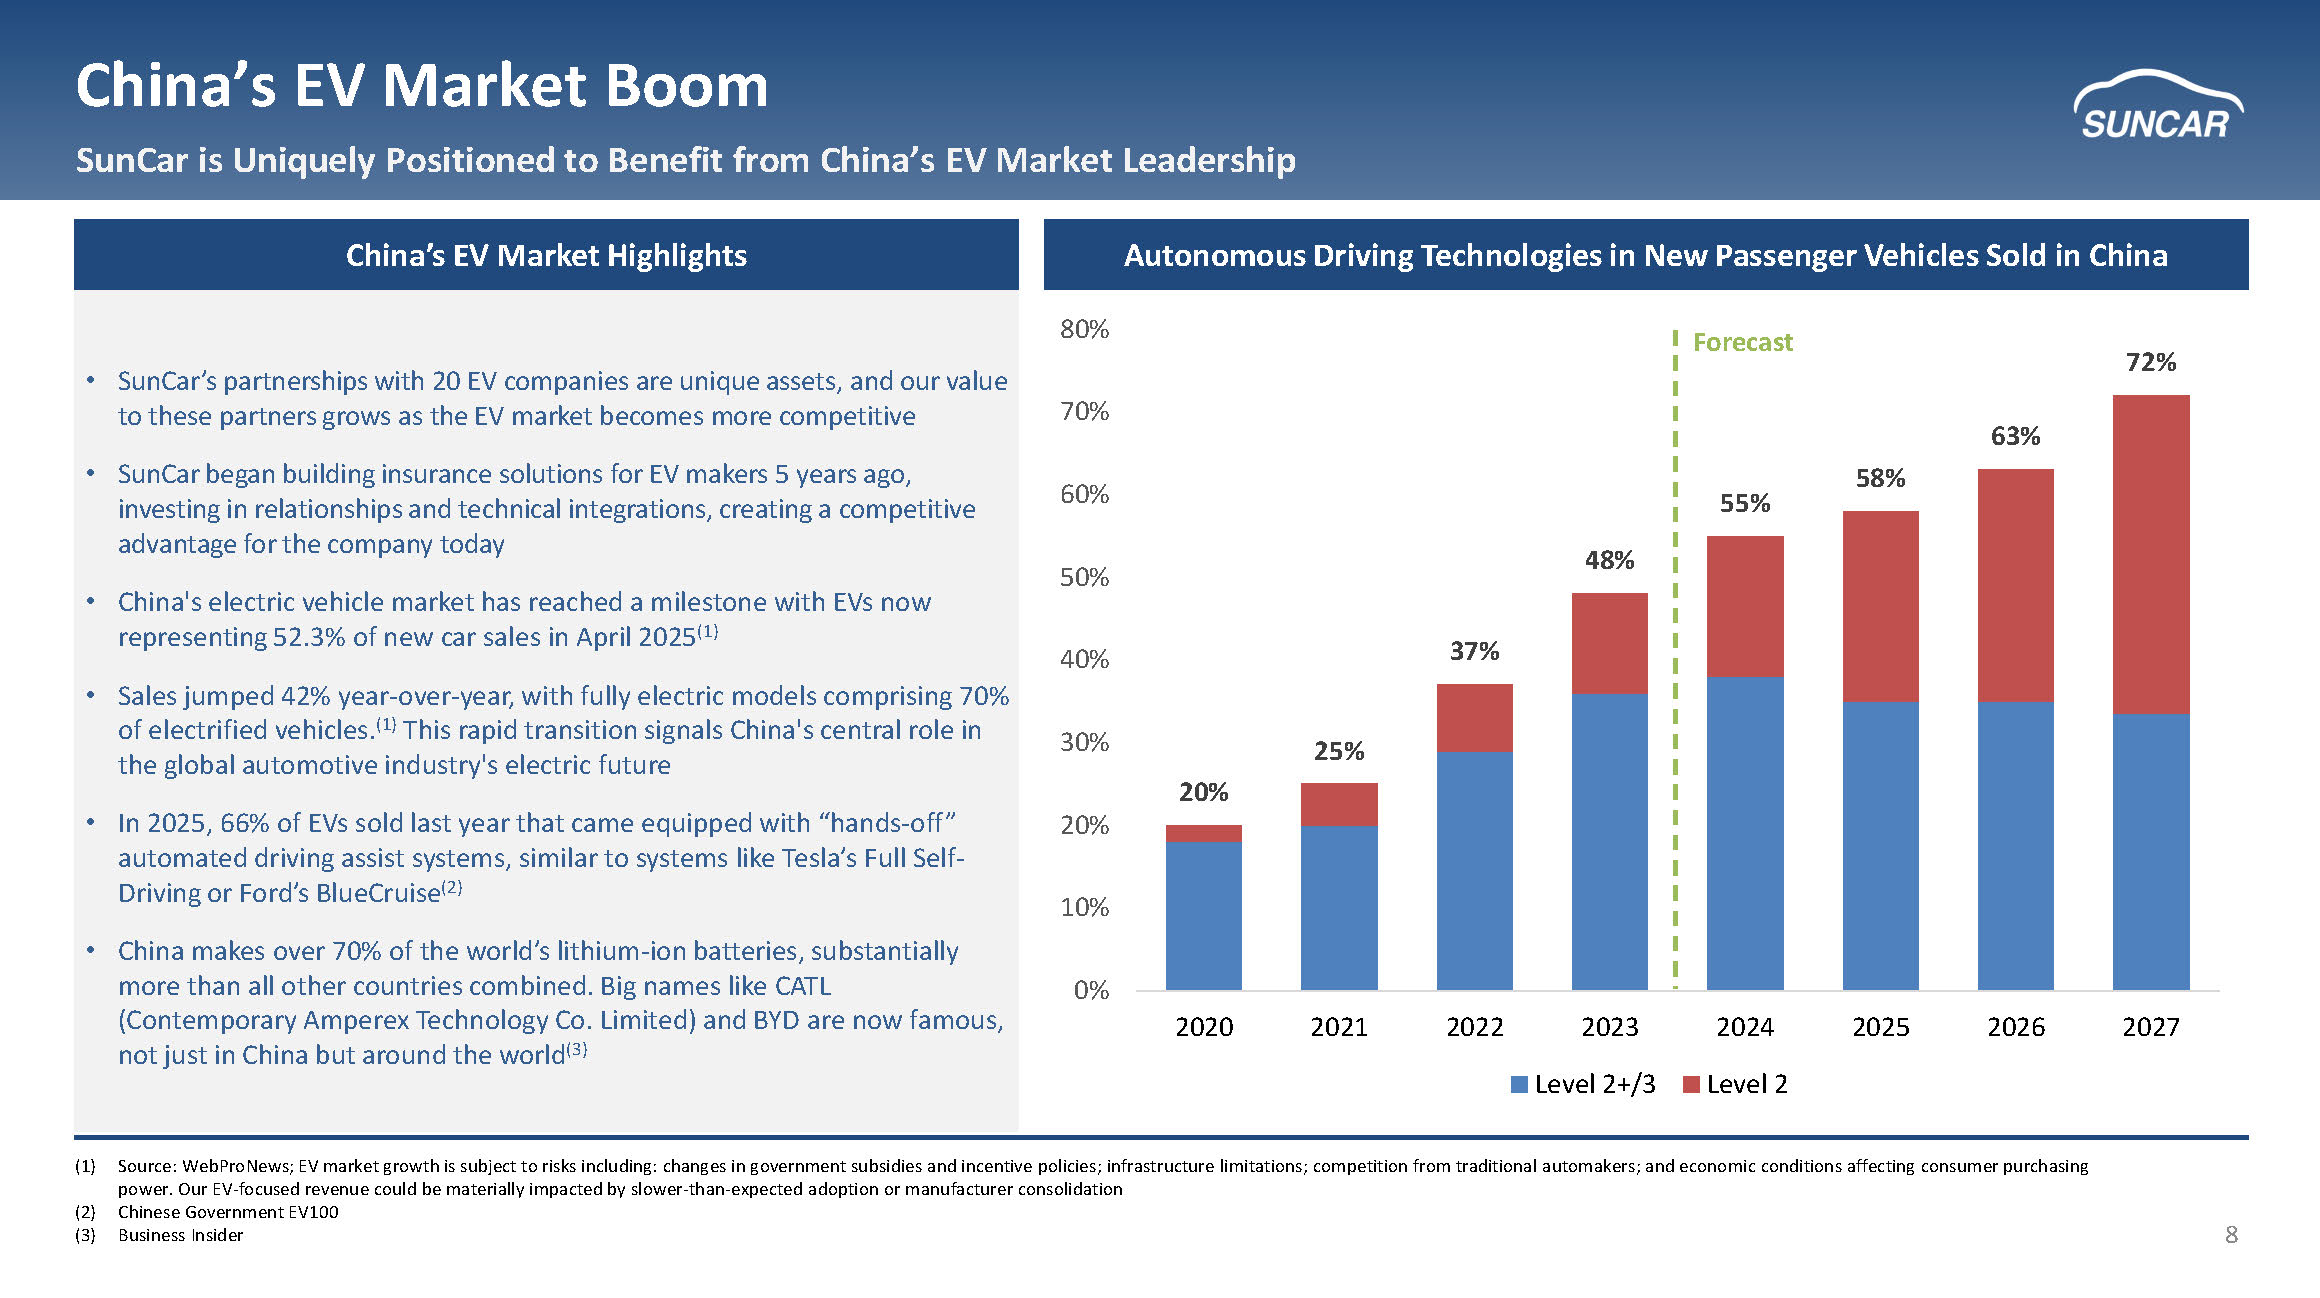
8 China’s EV Market Boom SunCar is Uniquely Positioned to Benefit from China’s EV Market Leadership (1) Source: WebProNews; EV market growth is subject to risks including: changes in government subsidies and incentive policies; i nfr astructure limitations; competition from traditional automakers; and economic conditions affecting consumer purchasing power. Our EV - focused revenue could be materially impacted by slower - than - expected adoption or manufacturer consolidation (2) Chinese Government EV100 (3) Business Insider China’s EV Market Highlights Autonomous Driving Technologies in New Passenger Vehicles Sold in China • SunCar’s partnerships with 20 EV companies are unique assets, and our value to these partners grows as the EV market becomes more competitive • SunCar began building insurance solutions for EV makers 5 years ago, investing in relationships and technical integrations, creating a competitive advantage for the company today • China's electric vehicle market has reached a milestone with EVs now representing 52.3% of new car sales in April 2025 (1) • Sales jumped 42% year - over - year, with fully electric models comprising 70% of electrified vehicles. (1) This rapid transition signals China's central role in the global automotive industry's electric future • In 2025, 66% of EVs sold last year that came equipped with “hands - off” automated driving assist systems, similar to systems like Tesla’s Full Self - Driving or Ford’s BlueCruise (2) • China makes over 70% of the world’s lithium - ion batteries, substantially more than all other countries combined. Big names like CATL (Contemporary Amperex Technology Co. Limited) and BYD are now famous, not just in China but around the world (3) 20% 25% 37% 48% 55% 58% 63% 72% 0% 10% 20% 30% 40% 50% 60% 70% 80% 2020 2021 2022 2023 2024 2025 2026 2027 Level 2+/3 Level 2 Forecast
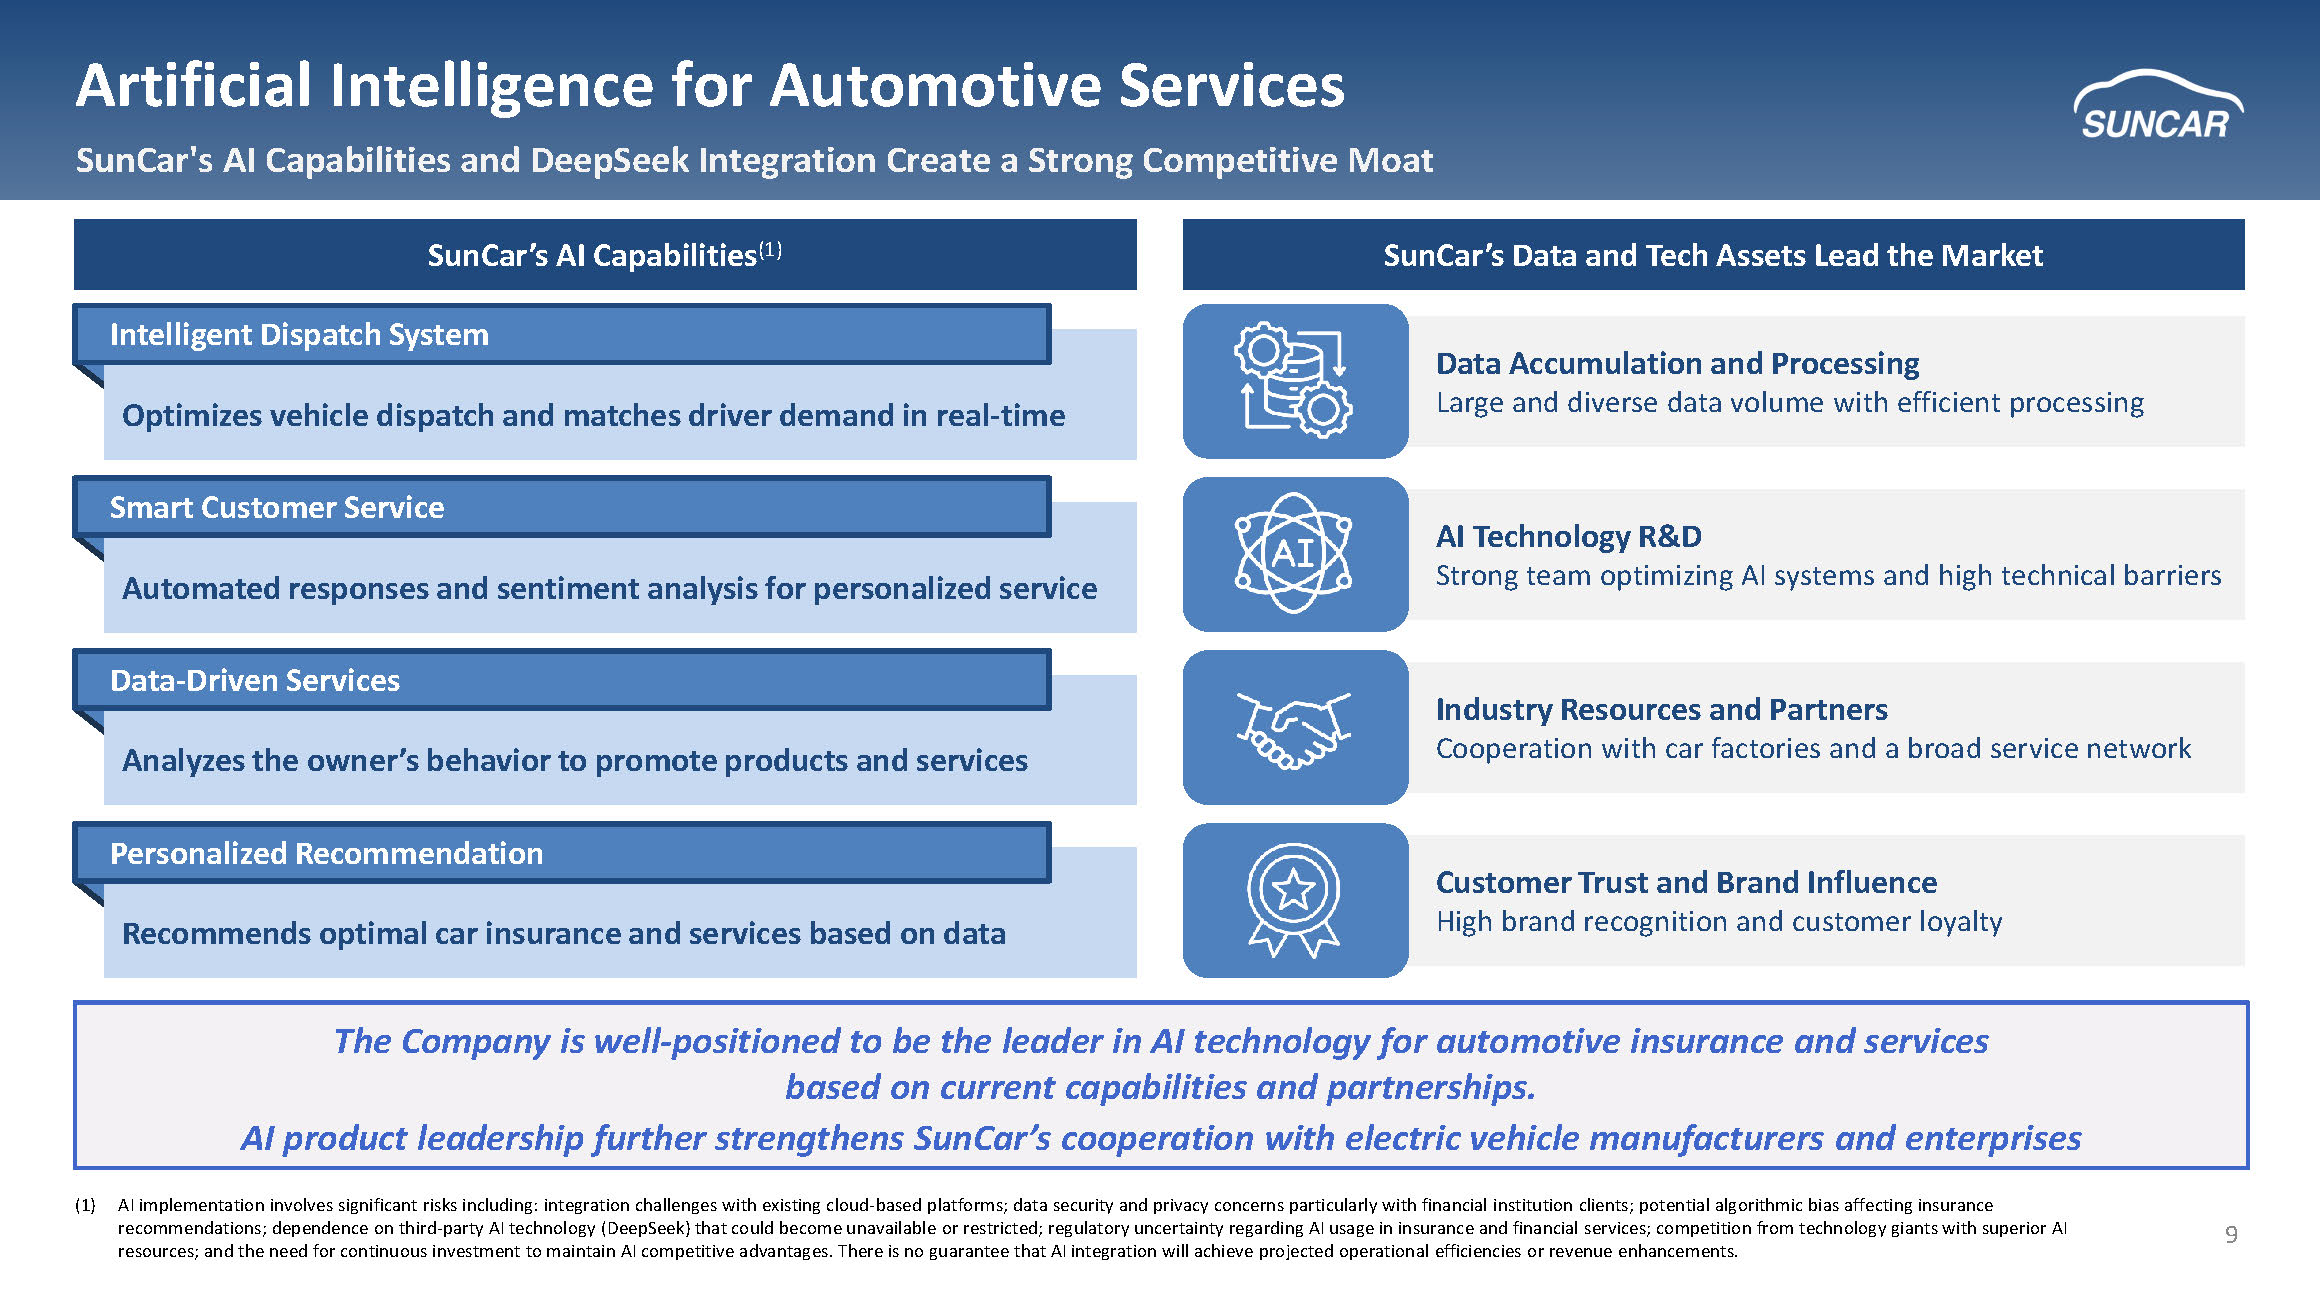
9 SunCar’s AI Capabilities (1) SunCar’s Data and Tech Assets Lead the Market Artificial Intelligence for Automotive Services SunCar's AI Capabilities and DeepSeek Integration Crea te a Strong Competitive Moat The Company is well - positioned to be the leader in AI technology for automotive insurance and services based on current capabilities and partnerships. AI product leadership further strengthens SunCar’s cooperation with electric vehicle manufacturers and enterprises Optimizes vehicle dispatch and matches driver demand in real - time Intelligent Dispatch System Data Accumulation and Processing Large and diverse data volume with efficient processing Automated responses and sentiment analysis for personalized service Smart Customer Service Analyzes the owner’s behavior to promote products and services Data - Driven Services Recommends optimal car insurance and services based on data Personalized Recommendation AI Technology R&D Strong team optimizing AI systems and high technical barriers Industry Resources and Partners Cooperation with car factories and a broad service network Customer Trust and Brand Influence High brand recognition and customer loyalty (1) AI implementation involves significant risks including: integration challenges with existing cloud - based platforms; data securit y and privacy concerns particularly with financial institution clients; potential algorithmic bias affecting insurance recommendations; dependence on third - party AI technology (DeepSeek) that could become unavailable or restricted; regulatory unce rtainty regarding AI usage in insurance and financial services; competition from technology giants with superior AI resources; and the need for continuous investment to maintain AI competitive advantages. There is no guarantee that AI integr ati on will achieve projected operational efficiencies or revenue enhancements.
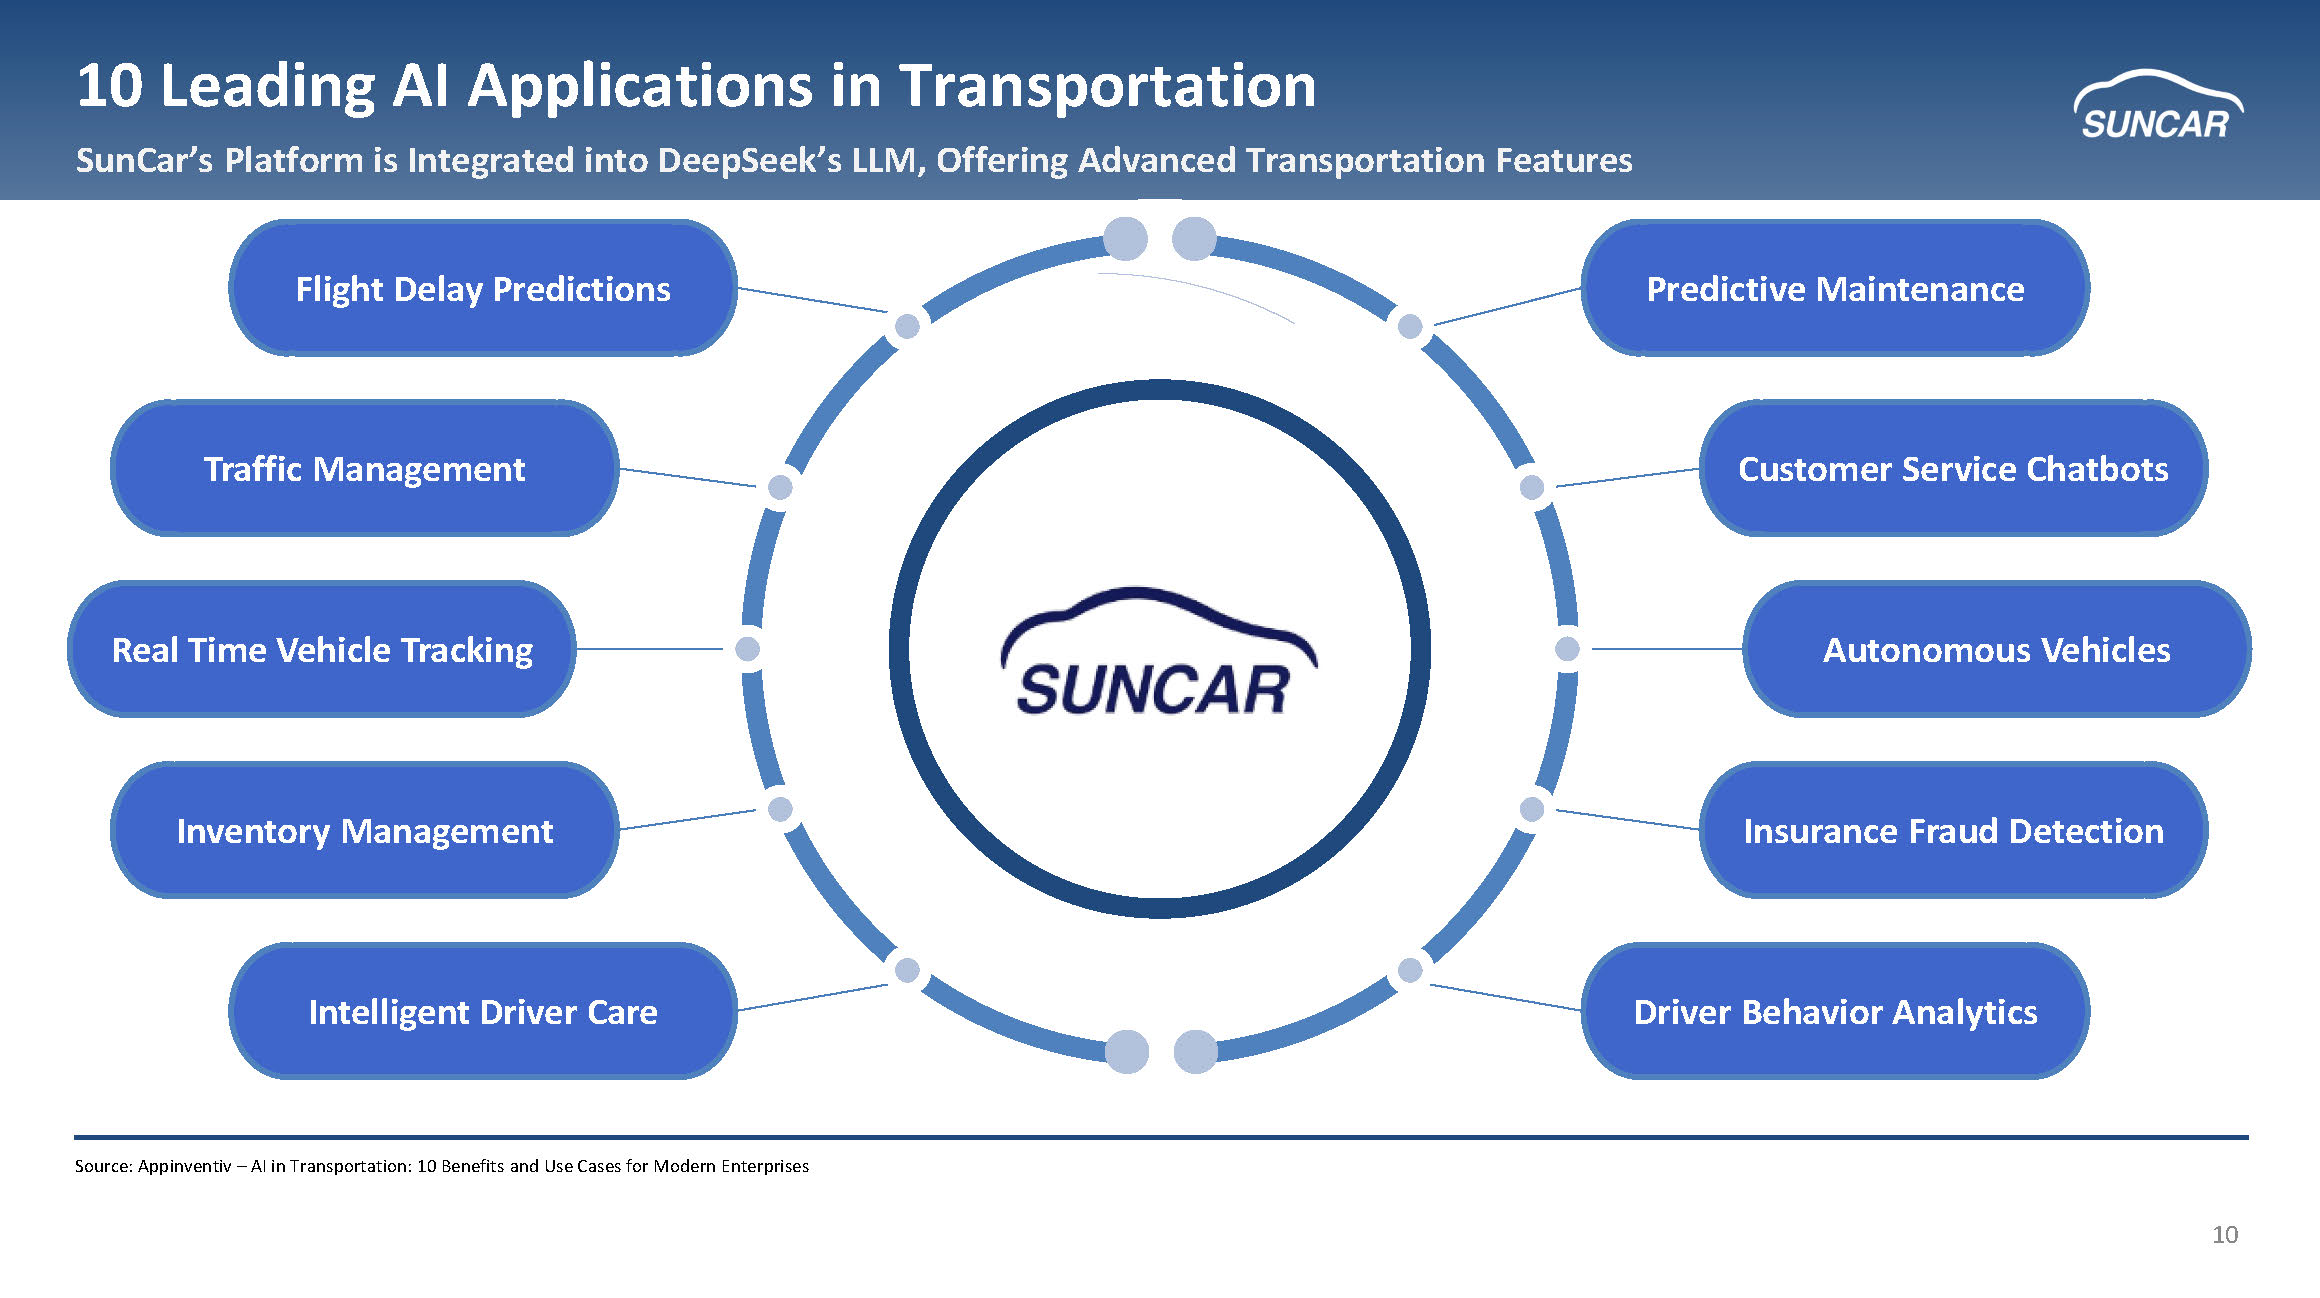
10 10 Leading AI Applications in Transportation SunCar’s Platform is Integrated into DeepSeek’s LLM, Offering Advanced Transportation Features Autonomous Vehicles Customer Service Chatbots Predictive Maintenance Insurance Fraud Detection Driver Behavior Analytics Intelligent Driver Care Inventory Management Real Time Vehicle Tracking Traffic Management Flight Delay Predictions Source: Appinventiv – AI in Transportation: 10 Benefits and Use Cases for Modern Enterprises
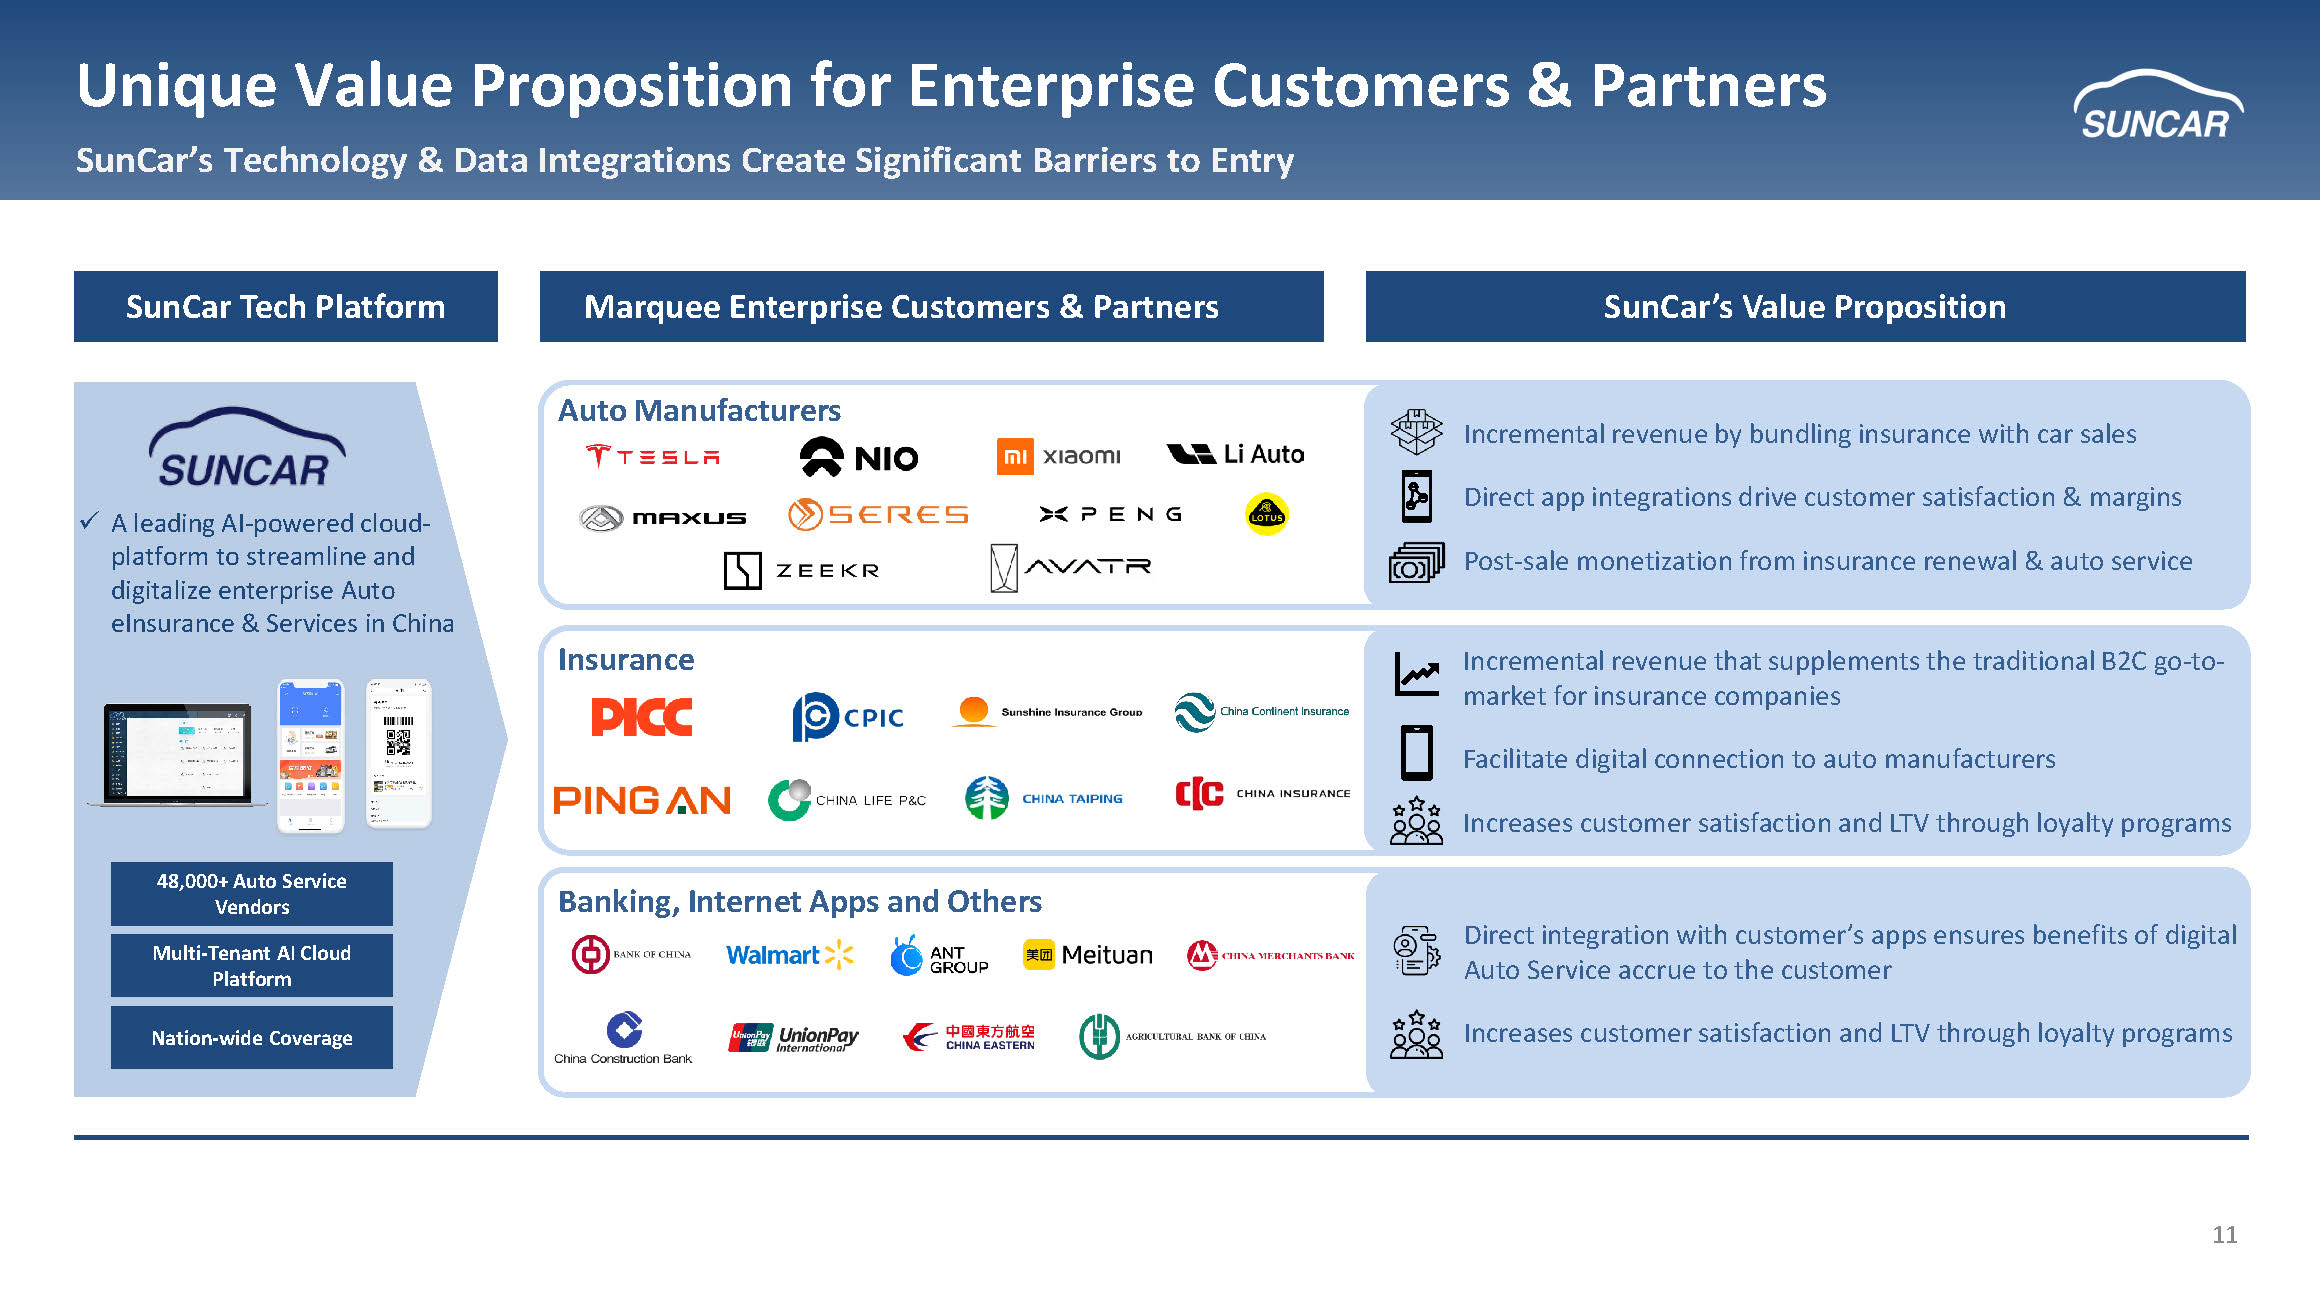
11 Marquee Enterprise Customers & Partners Unique Value Proposition for Enterprise Customers & Partners SunCar’s Technology & Data Integrations Create Significant Barriers to Entry Multi - Tenant AI Cloud Platform Nation - wide Coverage x A leading AI - powered cloud - platform to streamline and digitalize enterprise Auto eInsurance & Services in China Incremental revenue by bundling insurance with car sales Direct app integrations drive customer satisfaction & margins Post - sale monetization from insurance renewal & auto service SunCar Tech Platform SunCar’s Value Proposition Incremental revenue that supplements the traditional B2C go - to - market for insurance companies Facilitate digital connection to auto manufacturers Increases customer satisfaction and LTV through loyalty programs Direct integration with customer’s apps ensures benefits of digital Auto Service accrue to the customer Increases customer satisfaction and LTV through loyalty programs Auto Manufacturers Insurance Banking, Internet Apps and Others 48,000+ Auto Service Vendors
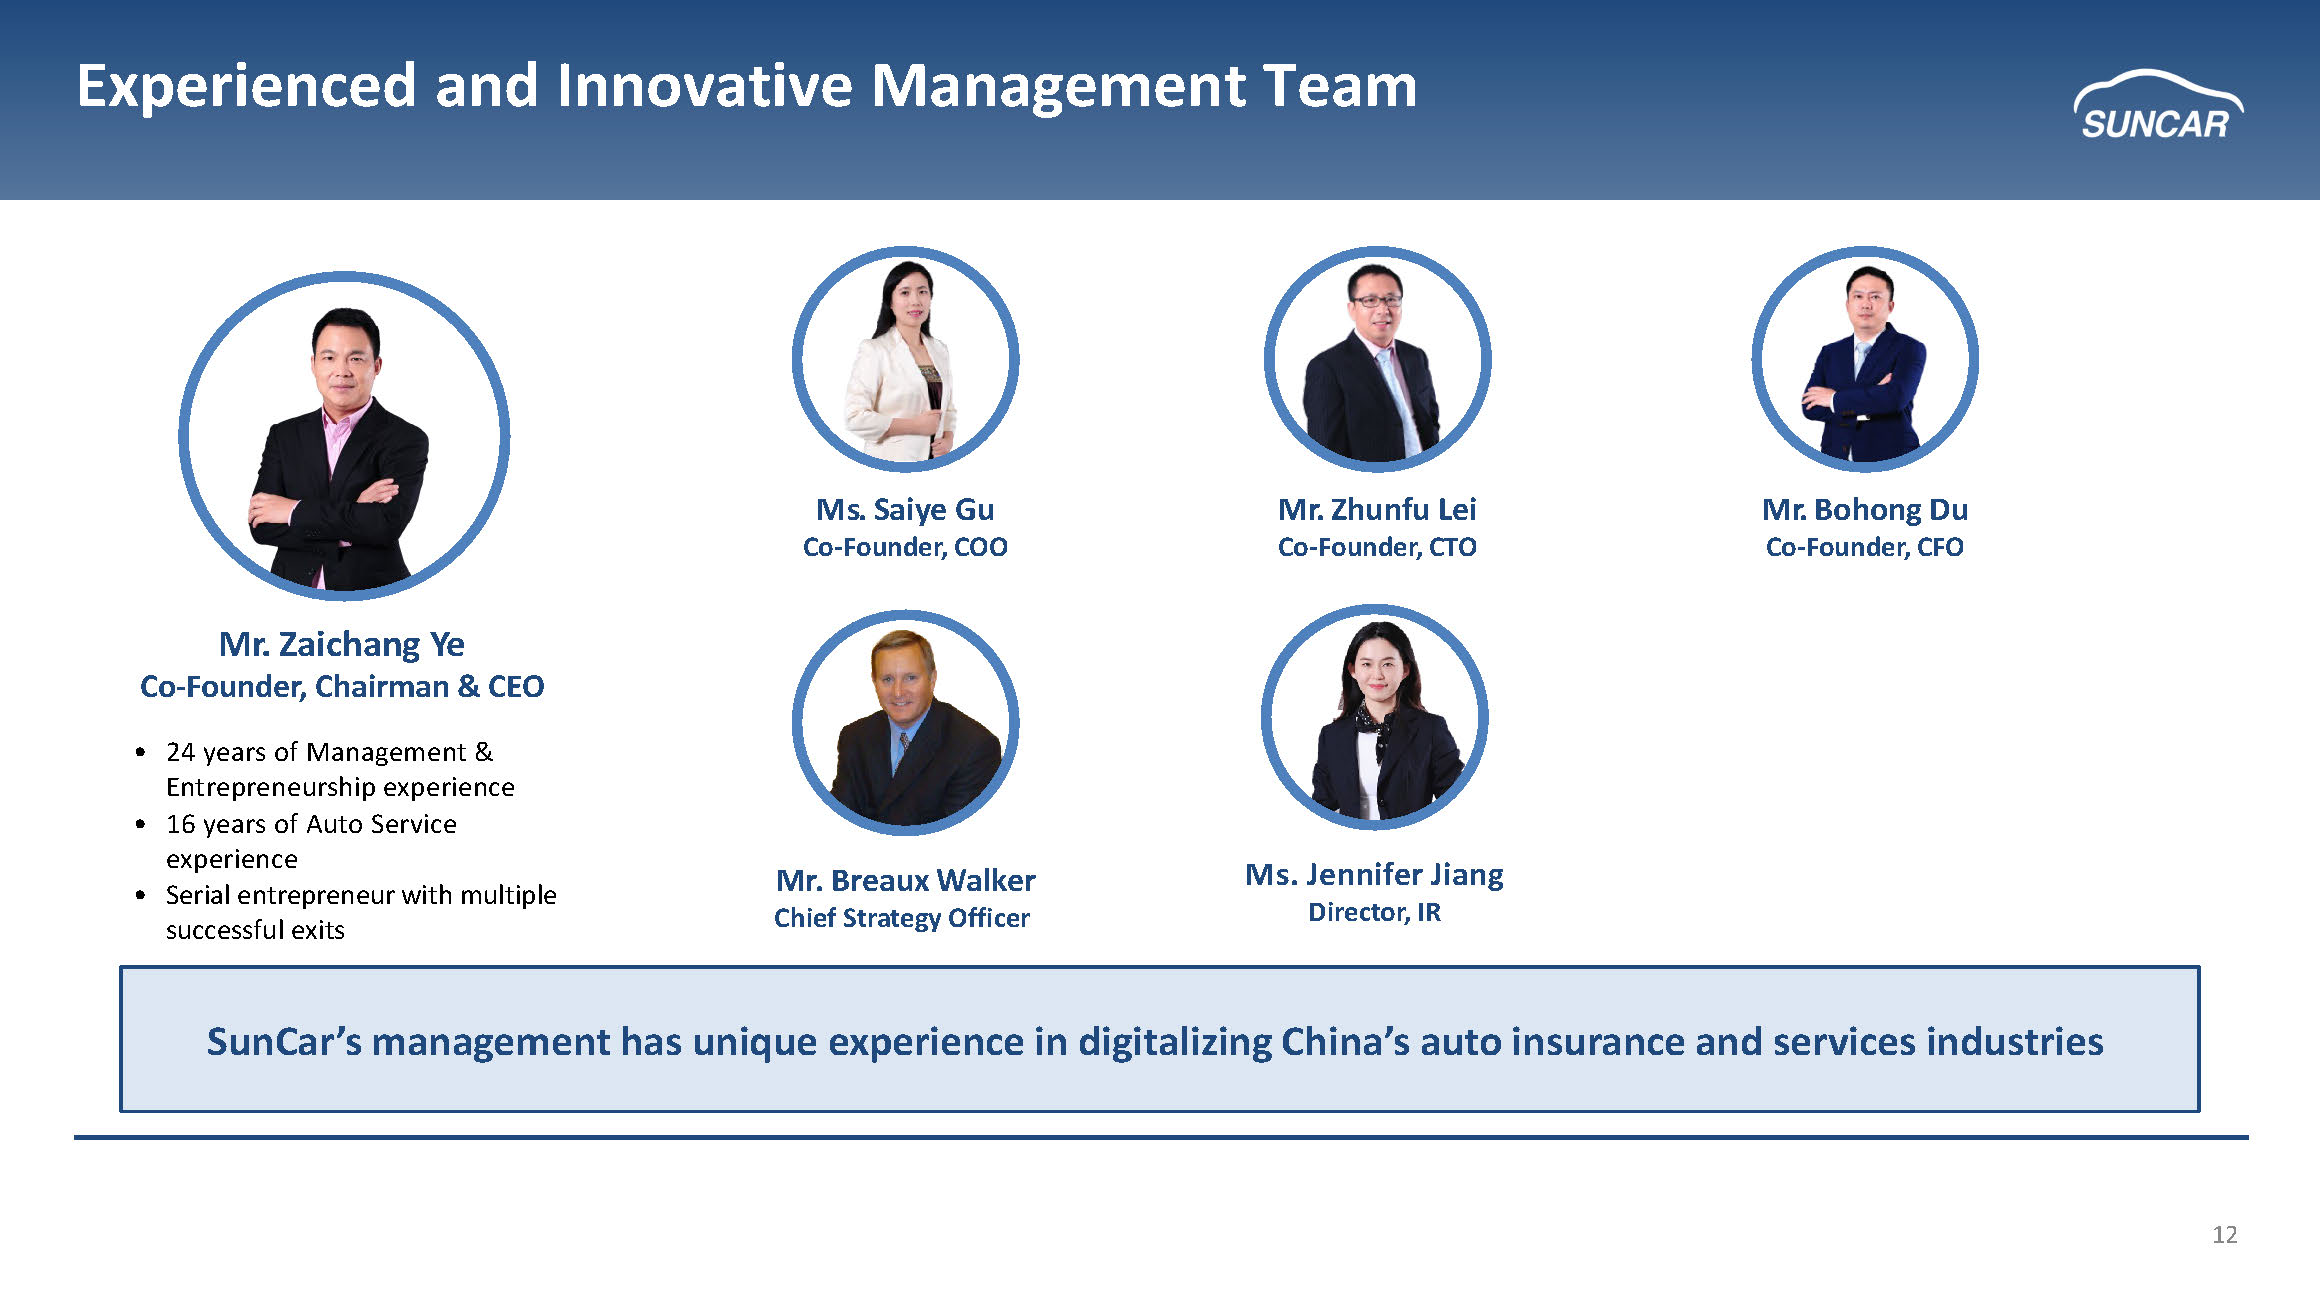
12 M r . Zaichang Ye Co - Founder, Chairman & CEO • 24 years of Management & Entrepreneurship experience • 16 years of Auto Service experience • Serial entrepreneur with multiple successful exits SunCar’s management has unique experience in digitalizing China’s auto insurance and services industries M r . Zhunfu Lei Co - Founder, CTO M s . Saiye Gu Co - Founder, COO M r . Bohong Du Co - Founder, CFO Experienced and Innovative Management Team Ms. Jennifer Jiang Director, IR Mr. Breaux Walker Chief Strategy Officer
13 Auto Insurance and Services Markets in China
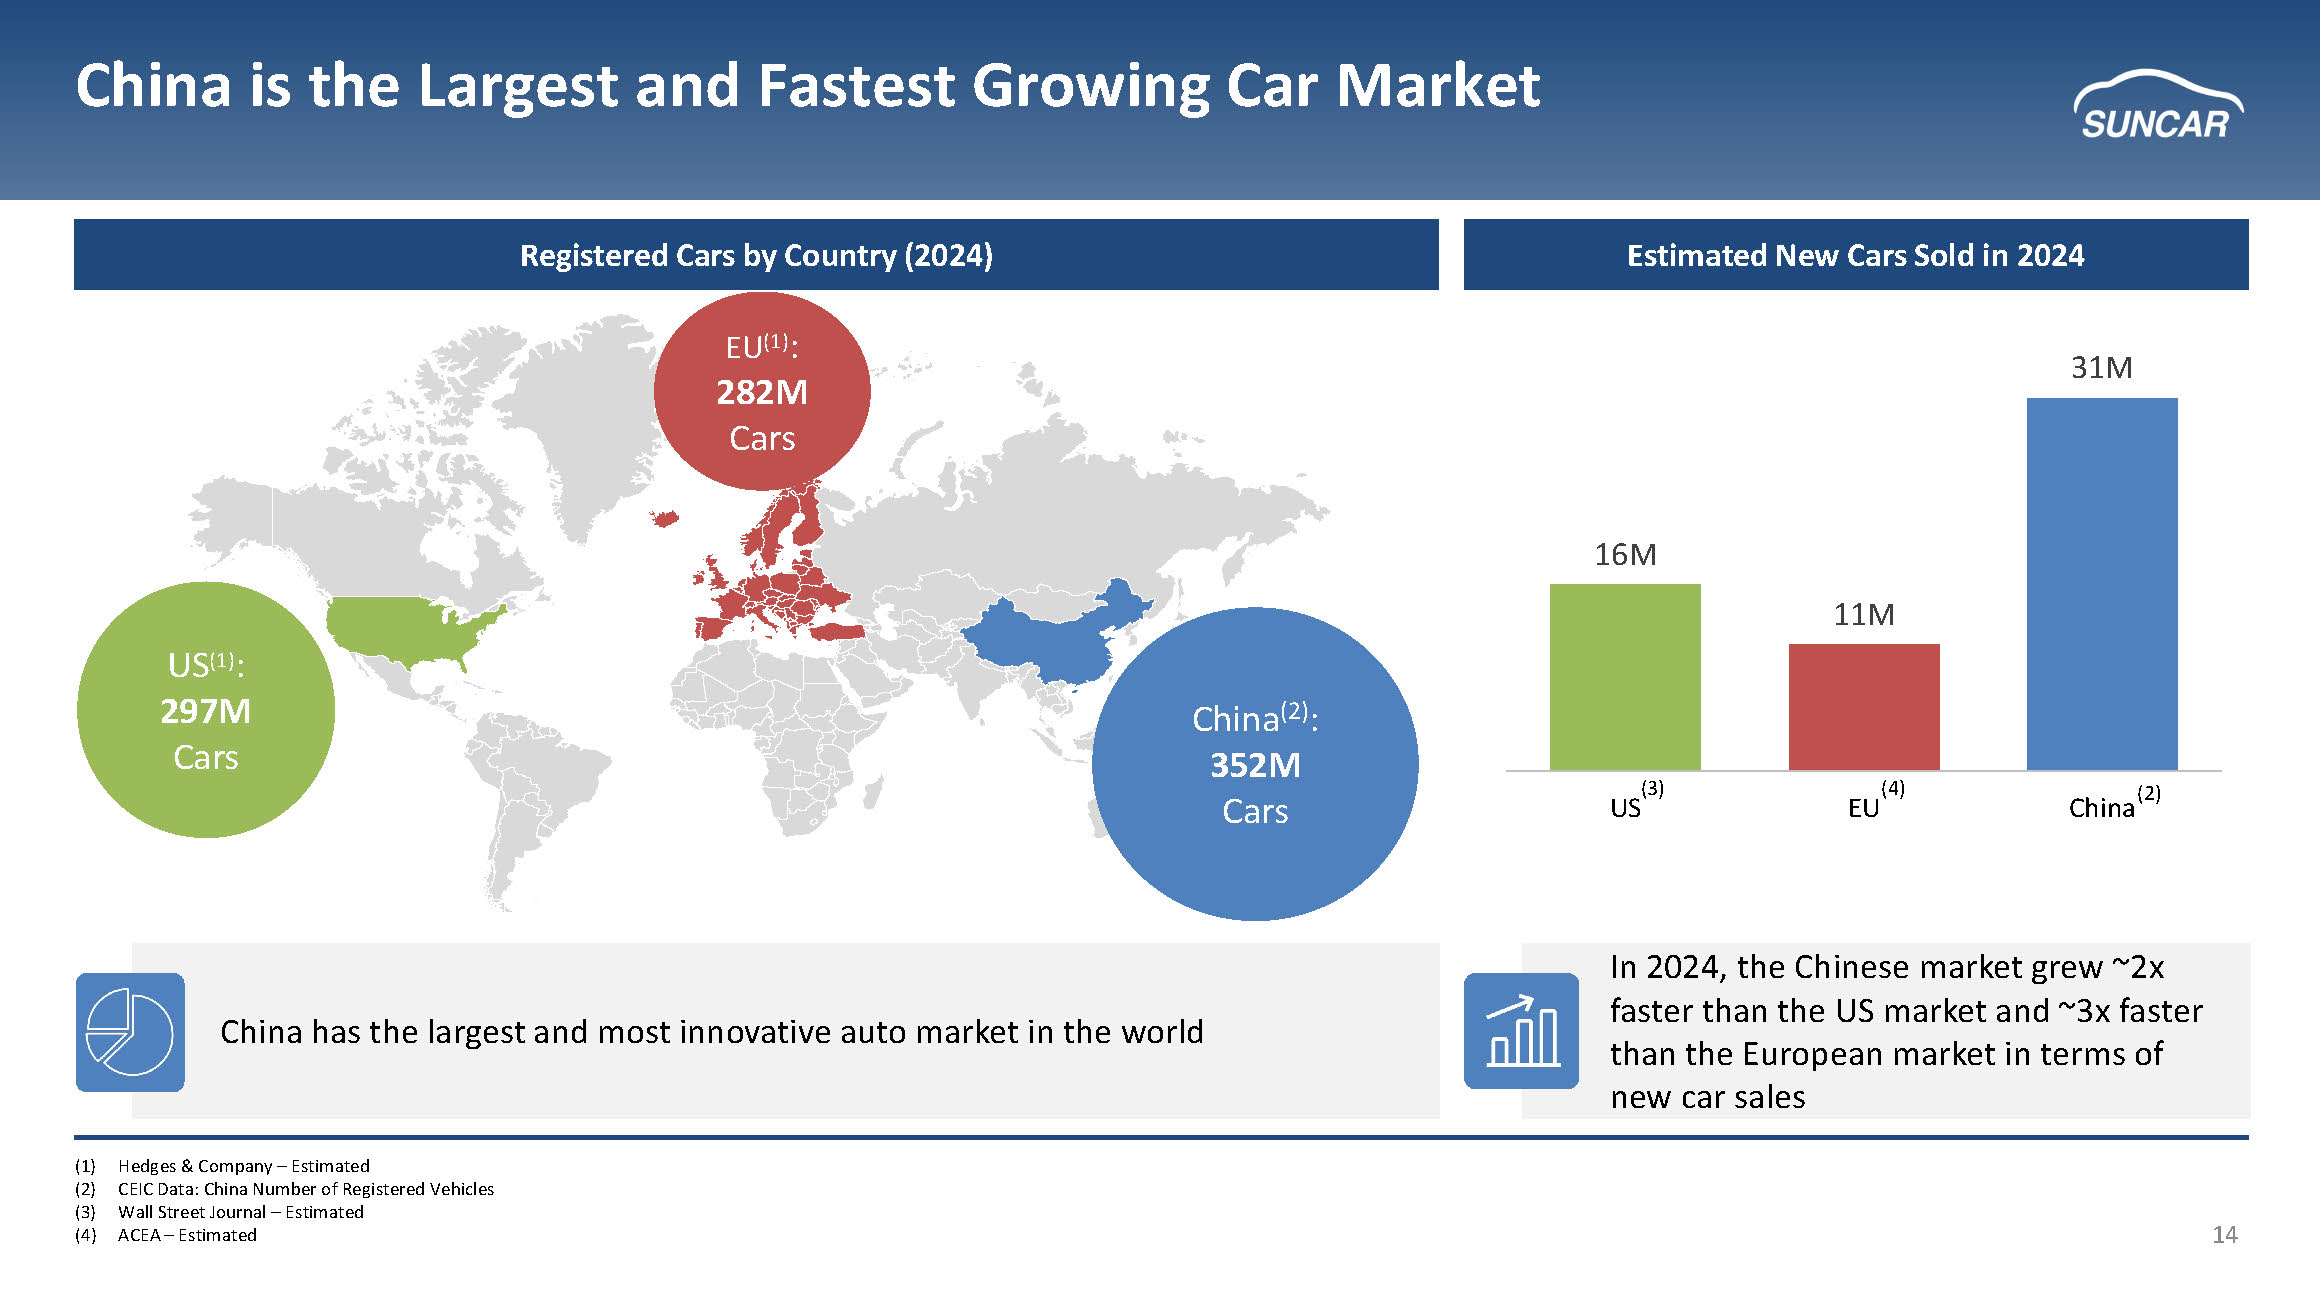
14 China has the largest and most innovative auto market in the world China is the Largest and Fastest Growing Car Market (1) Hedges & Company – Estimated (2) CEIC Data: China Number of Registered Vehicles (3) Wall Street Journal – Estimated (4) ACEA – Estimated 16M 11M 31M US EU China Registered Cars by Country (2024) Estimated New Cars Sold in 2024 In 2024, the Chinese market grew ~2x faster than the US market and ~3x faster than the European market in terms of new car sales China (2) : 352M Cars US (1) : 297M Cars EU (1) : 282M Cars (3) (4) (2)
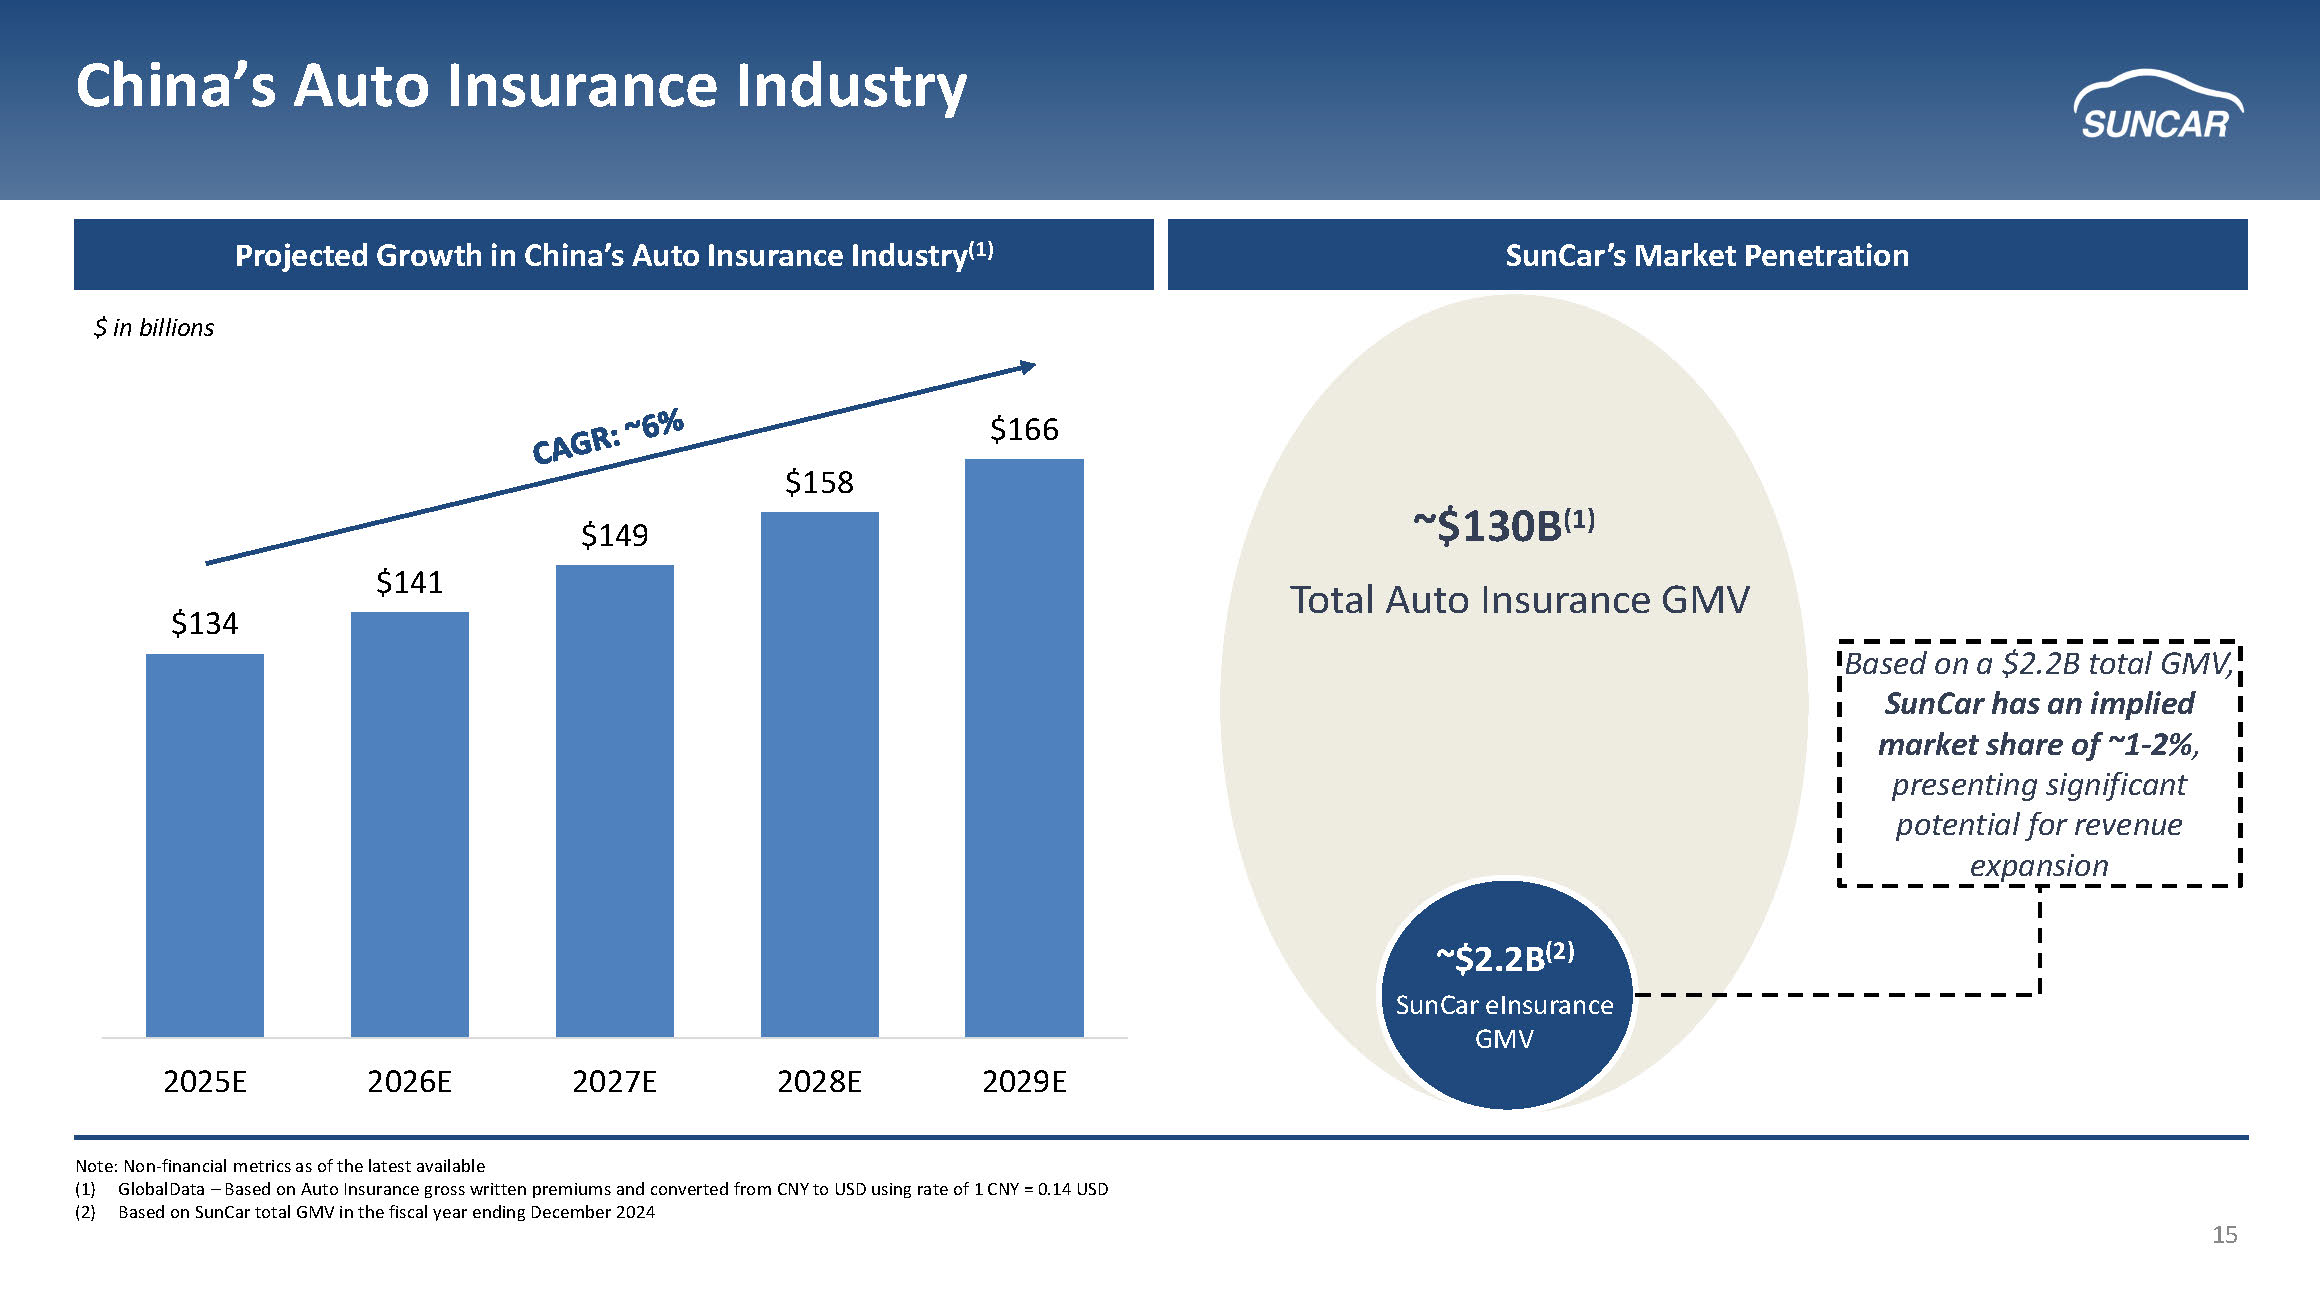
15 China’s Auto Insurance Industry (2) (3) $121B Total Market (2) (3) ~$130B (1) Total Auto Insurance GMV $ in billions Based on a $2.2B total GMV, SunCar has an implied market share of ~1 - 2% , presenting significant potential for revenue expansion ~$2.2B (2) SunCar eInsurance GMV Projected Growth in China’s Auto Insurance Industry (1) SunCar’s Market Penetration $134 $141 $149 $158 $166 2025E 2026E 2027E 2028E 2029E Note: Non - financial metrics as of the latest available (1) GlobalData – Based on Auto Insurance gross written premiums and converted from CNY to USD using rate of 1 CNY = 0.14 USD (2) Based on SunCar total GMV in the fiscal year ending December 2024
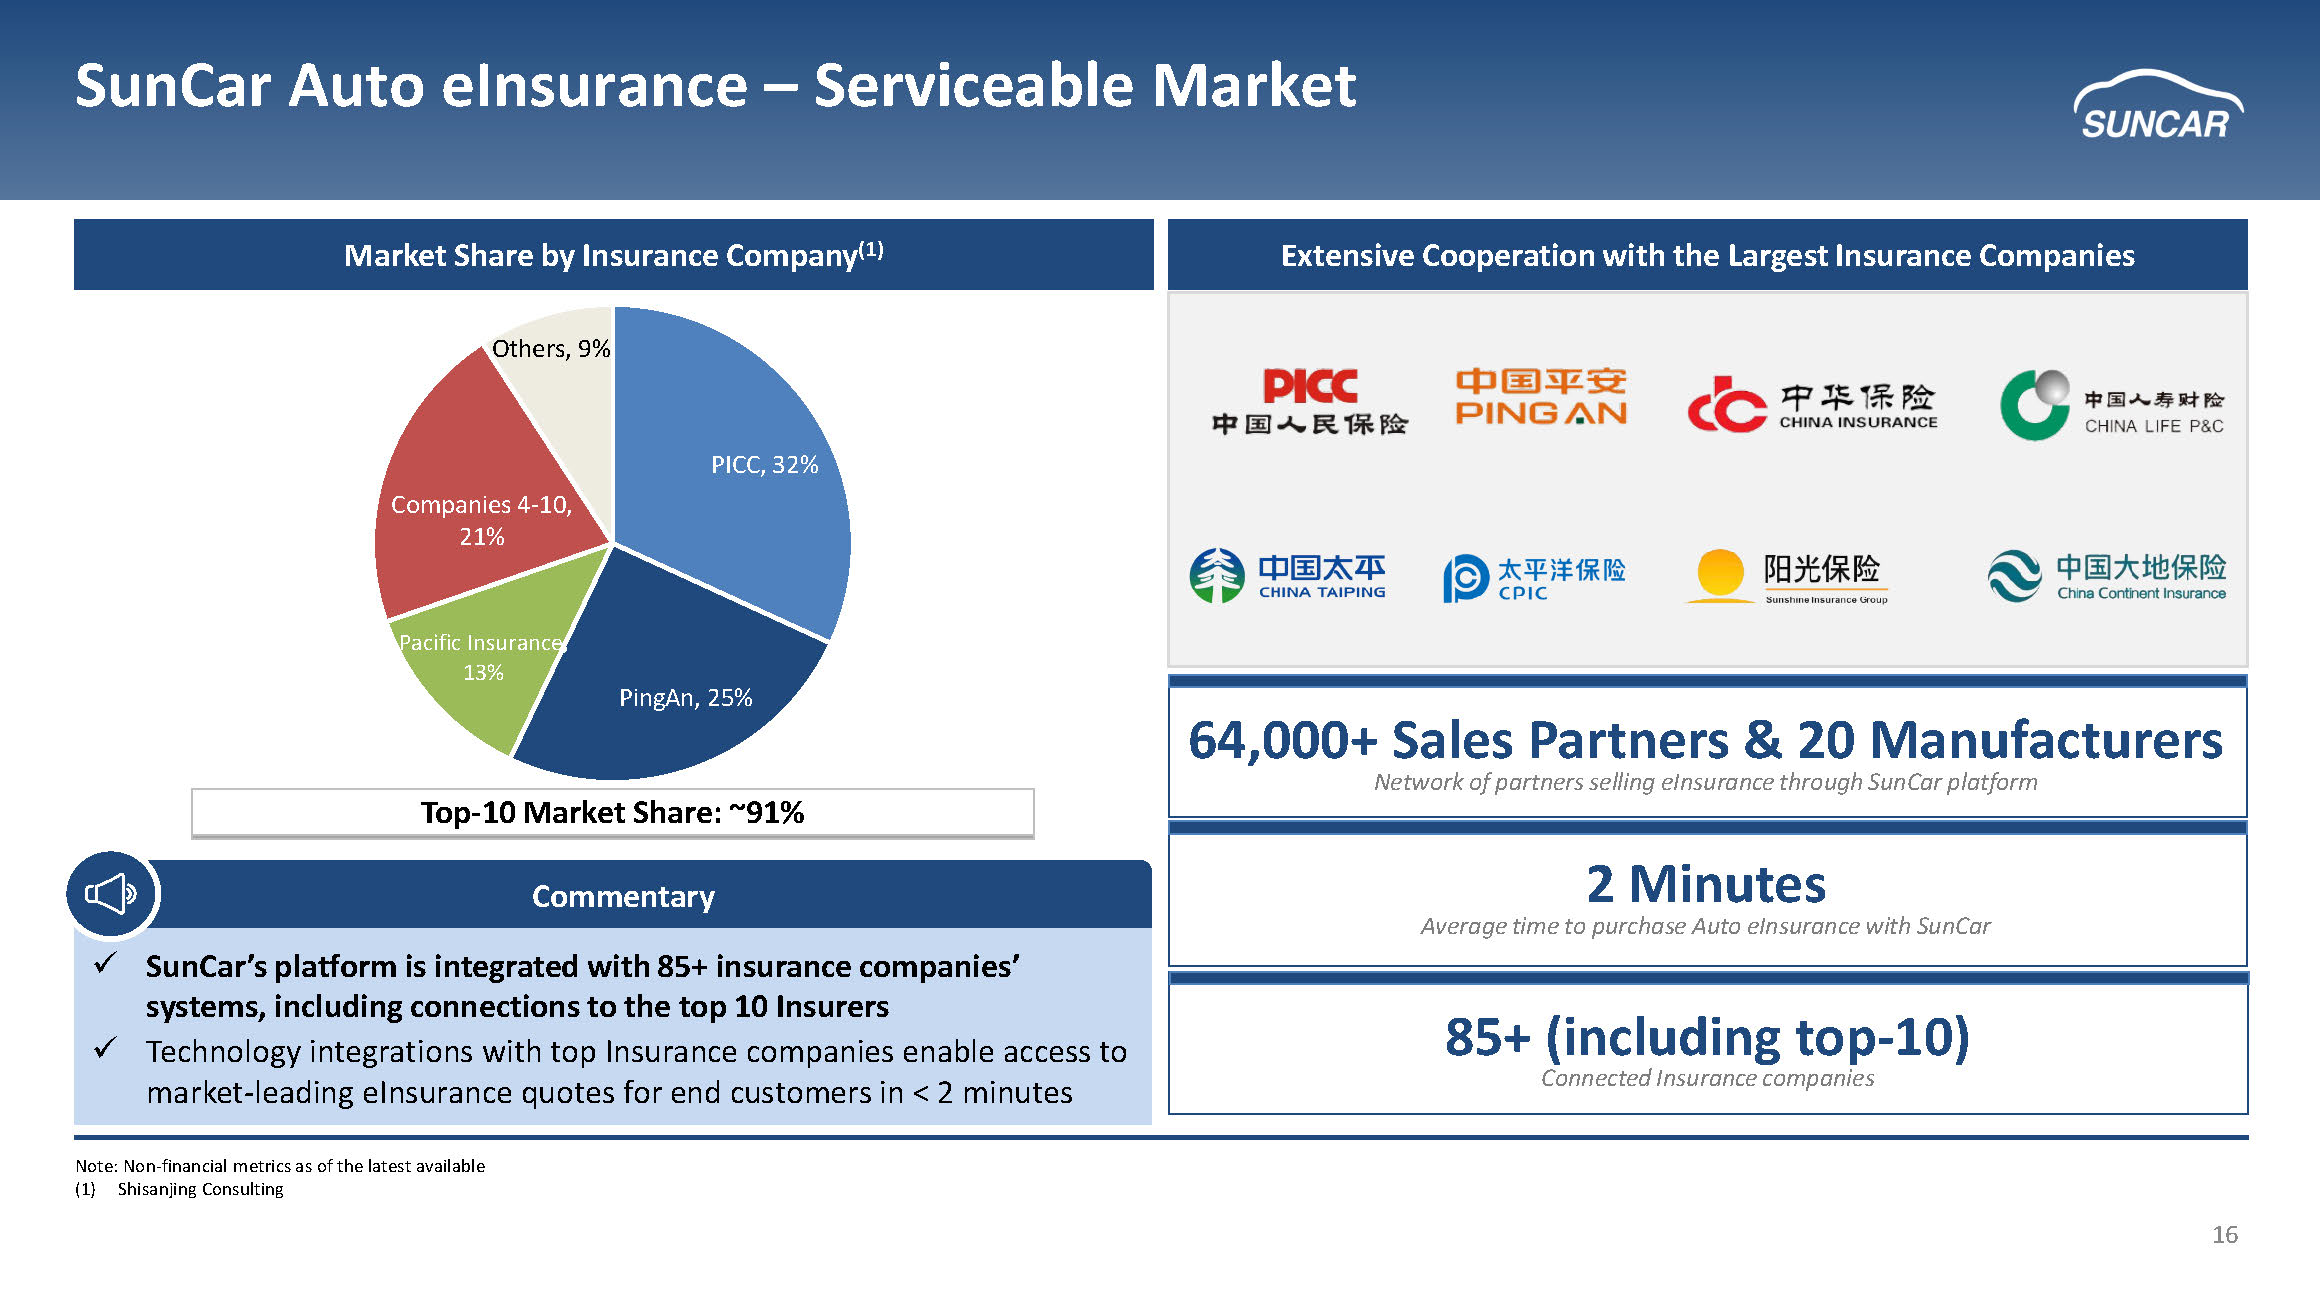
16 SunCar Auto eInsurance – Serviceable Market PICC , 32% PingAn , 25% Pacific Insurance , 13% Companies 4 - 10, 21% Others , 9% Top - 10 Market Share: ~91% x SunCar’s platform is integrated with 85+ insurance companies’ systems, including connections to the top 10 Insurers x Technology integrations with top Insurance companies enable access to market - leading eInsurance quotes for end customers in < 2 minutes Commentary 64,000+ Sales Partners & 20 Manufacturers Network of partners selling eInsurance through SunCar platform 2 Minutes Average time to purchase Auto eInsurance with SunCar 85+ (including top - 10) Connected Insurance companies Market Share by Insurance Company (1) Extensive Cooperation with the Largest Insurance Companies Note: Non - financial metrics as of the latest available (1) Shisanjing Consulting
17 Technology - Enabled Auto Insurance
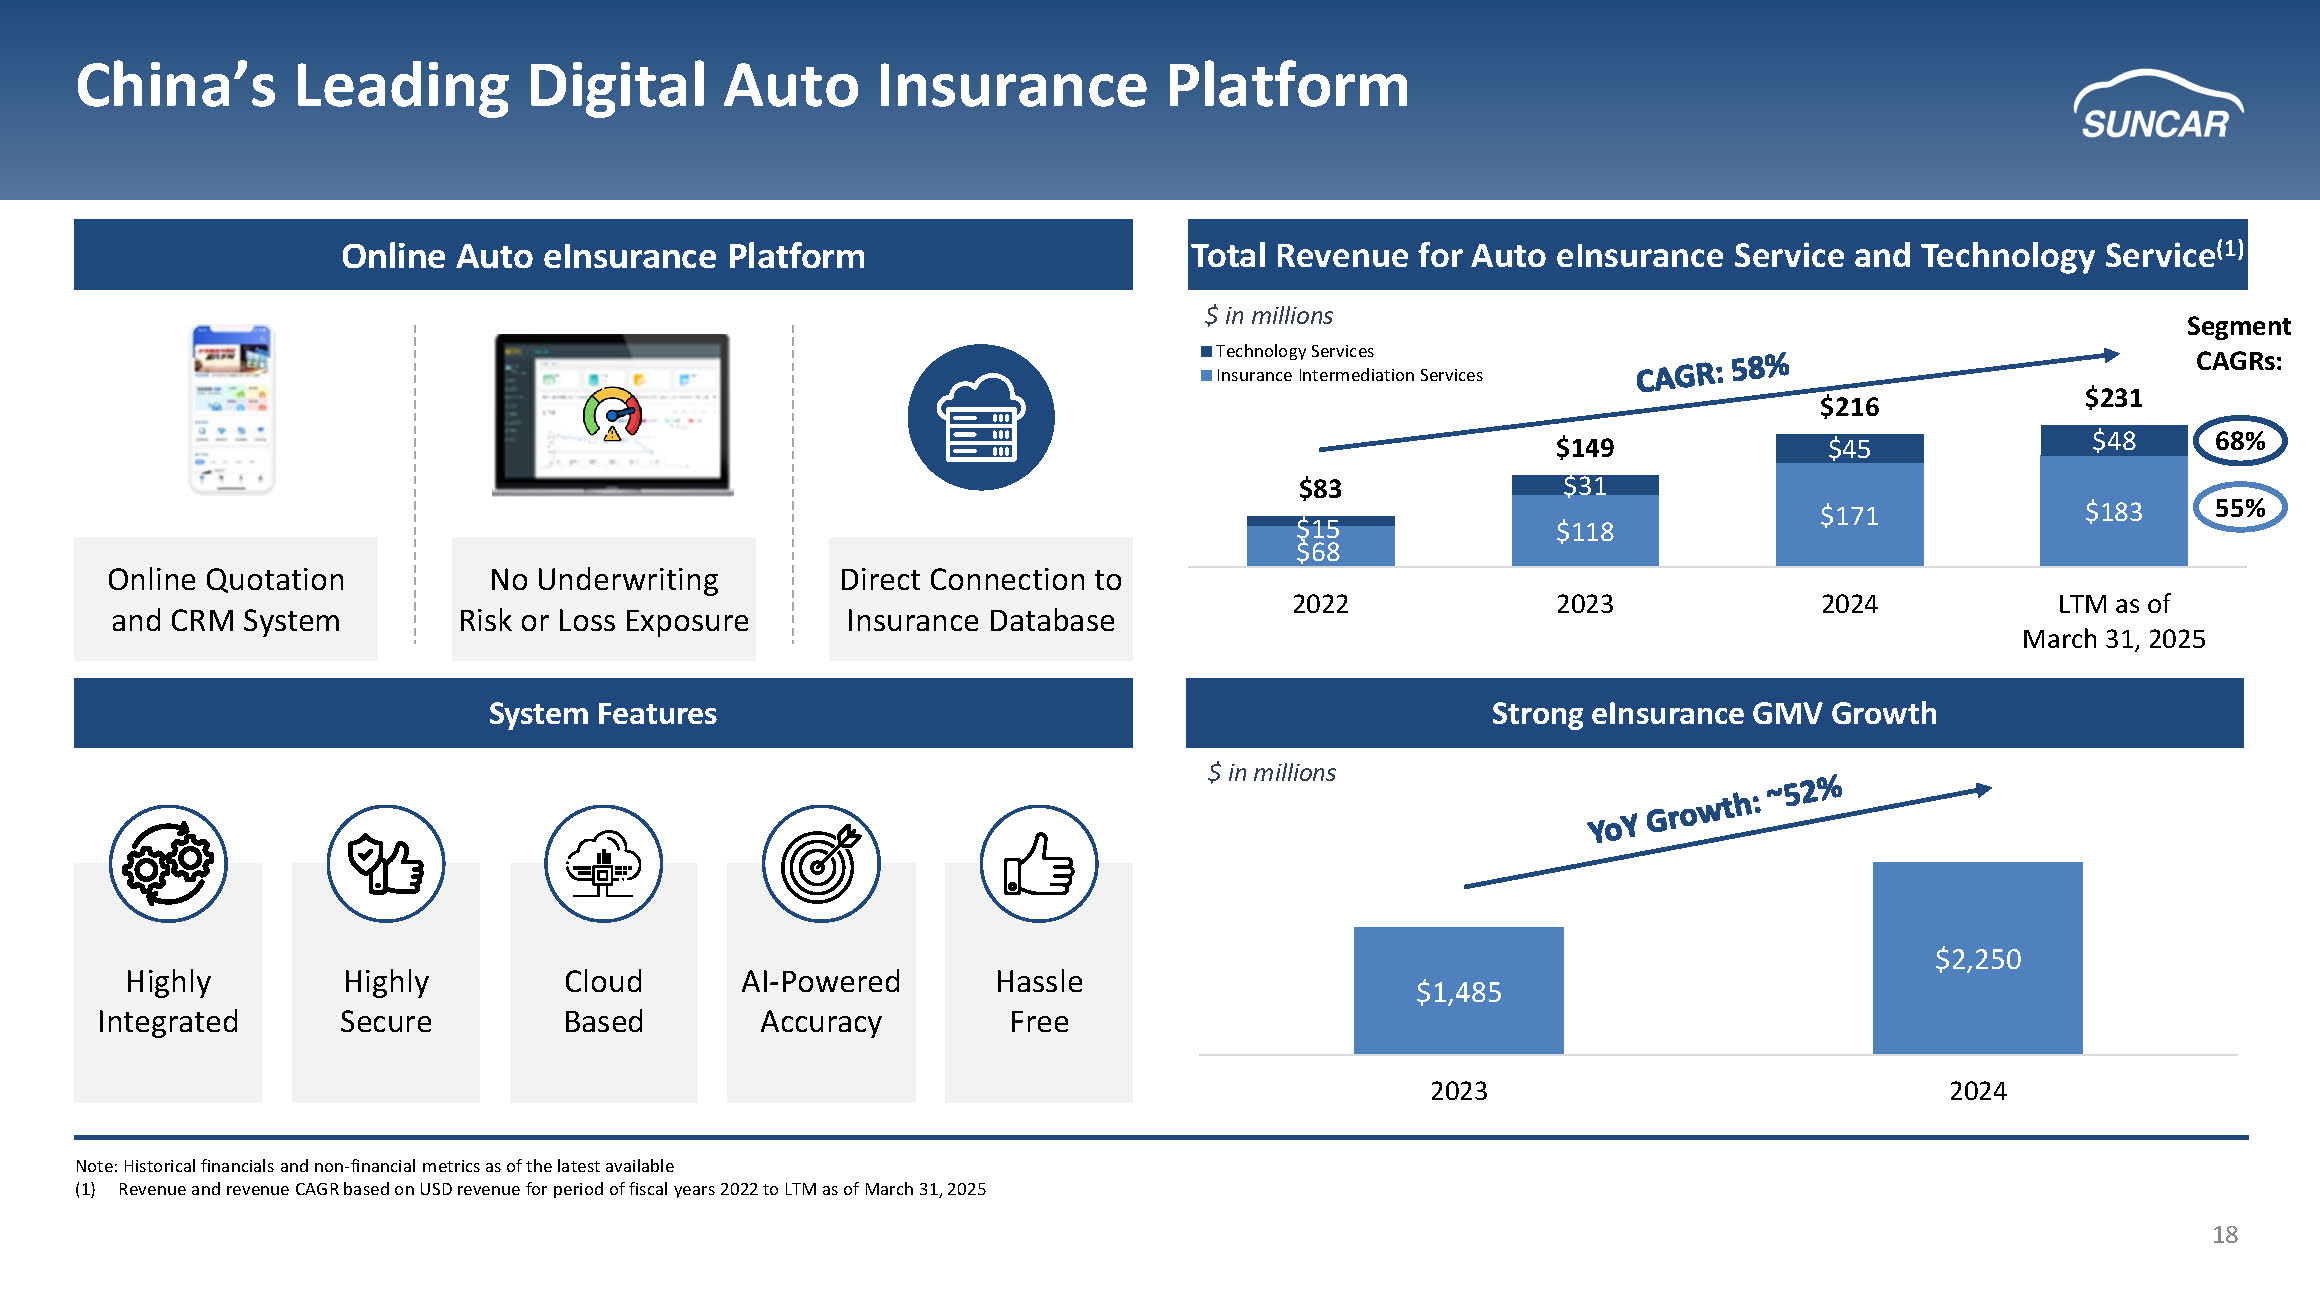
18 $1,485 $2,250 2023 2024 $68 $118 $171 $183 $15 $31 $45 $48 $83 $149 $216 $231 2022 2023 2024 LTM as of March 31, 2025 Technology Services Insurance Intermediation Services China’s Leading Digital Auto Insurance Platform Online Quotation and CRM System No Underwriting Risk or Loss Exposure Direct Connection to Insurance Database System Features Highly Integrated Highly Secure Cloud Based AI - Powered Accuracy Hassle Free Strong eInsurance GMV Growth Online Auto eInsurance Platform Total Revenue for Auto eInsurance Service and Technology Service (1) $ in millions $ in millions Note: Historical financials and non - financial metrics as of the latest available (1) Revenue and revenue CAGR based on USD revenue for period of fiscal years 2022 to LTM as of March 31, 2025 68% 55% Segment CAGRs:
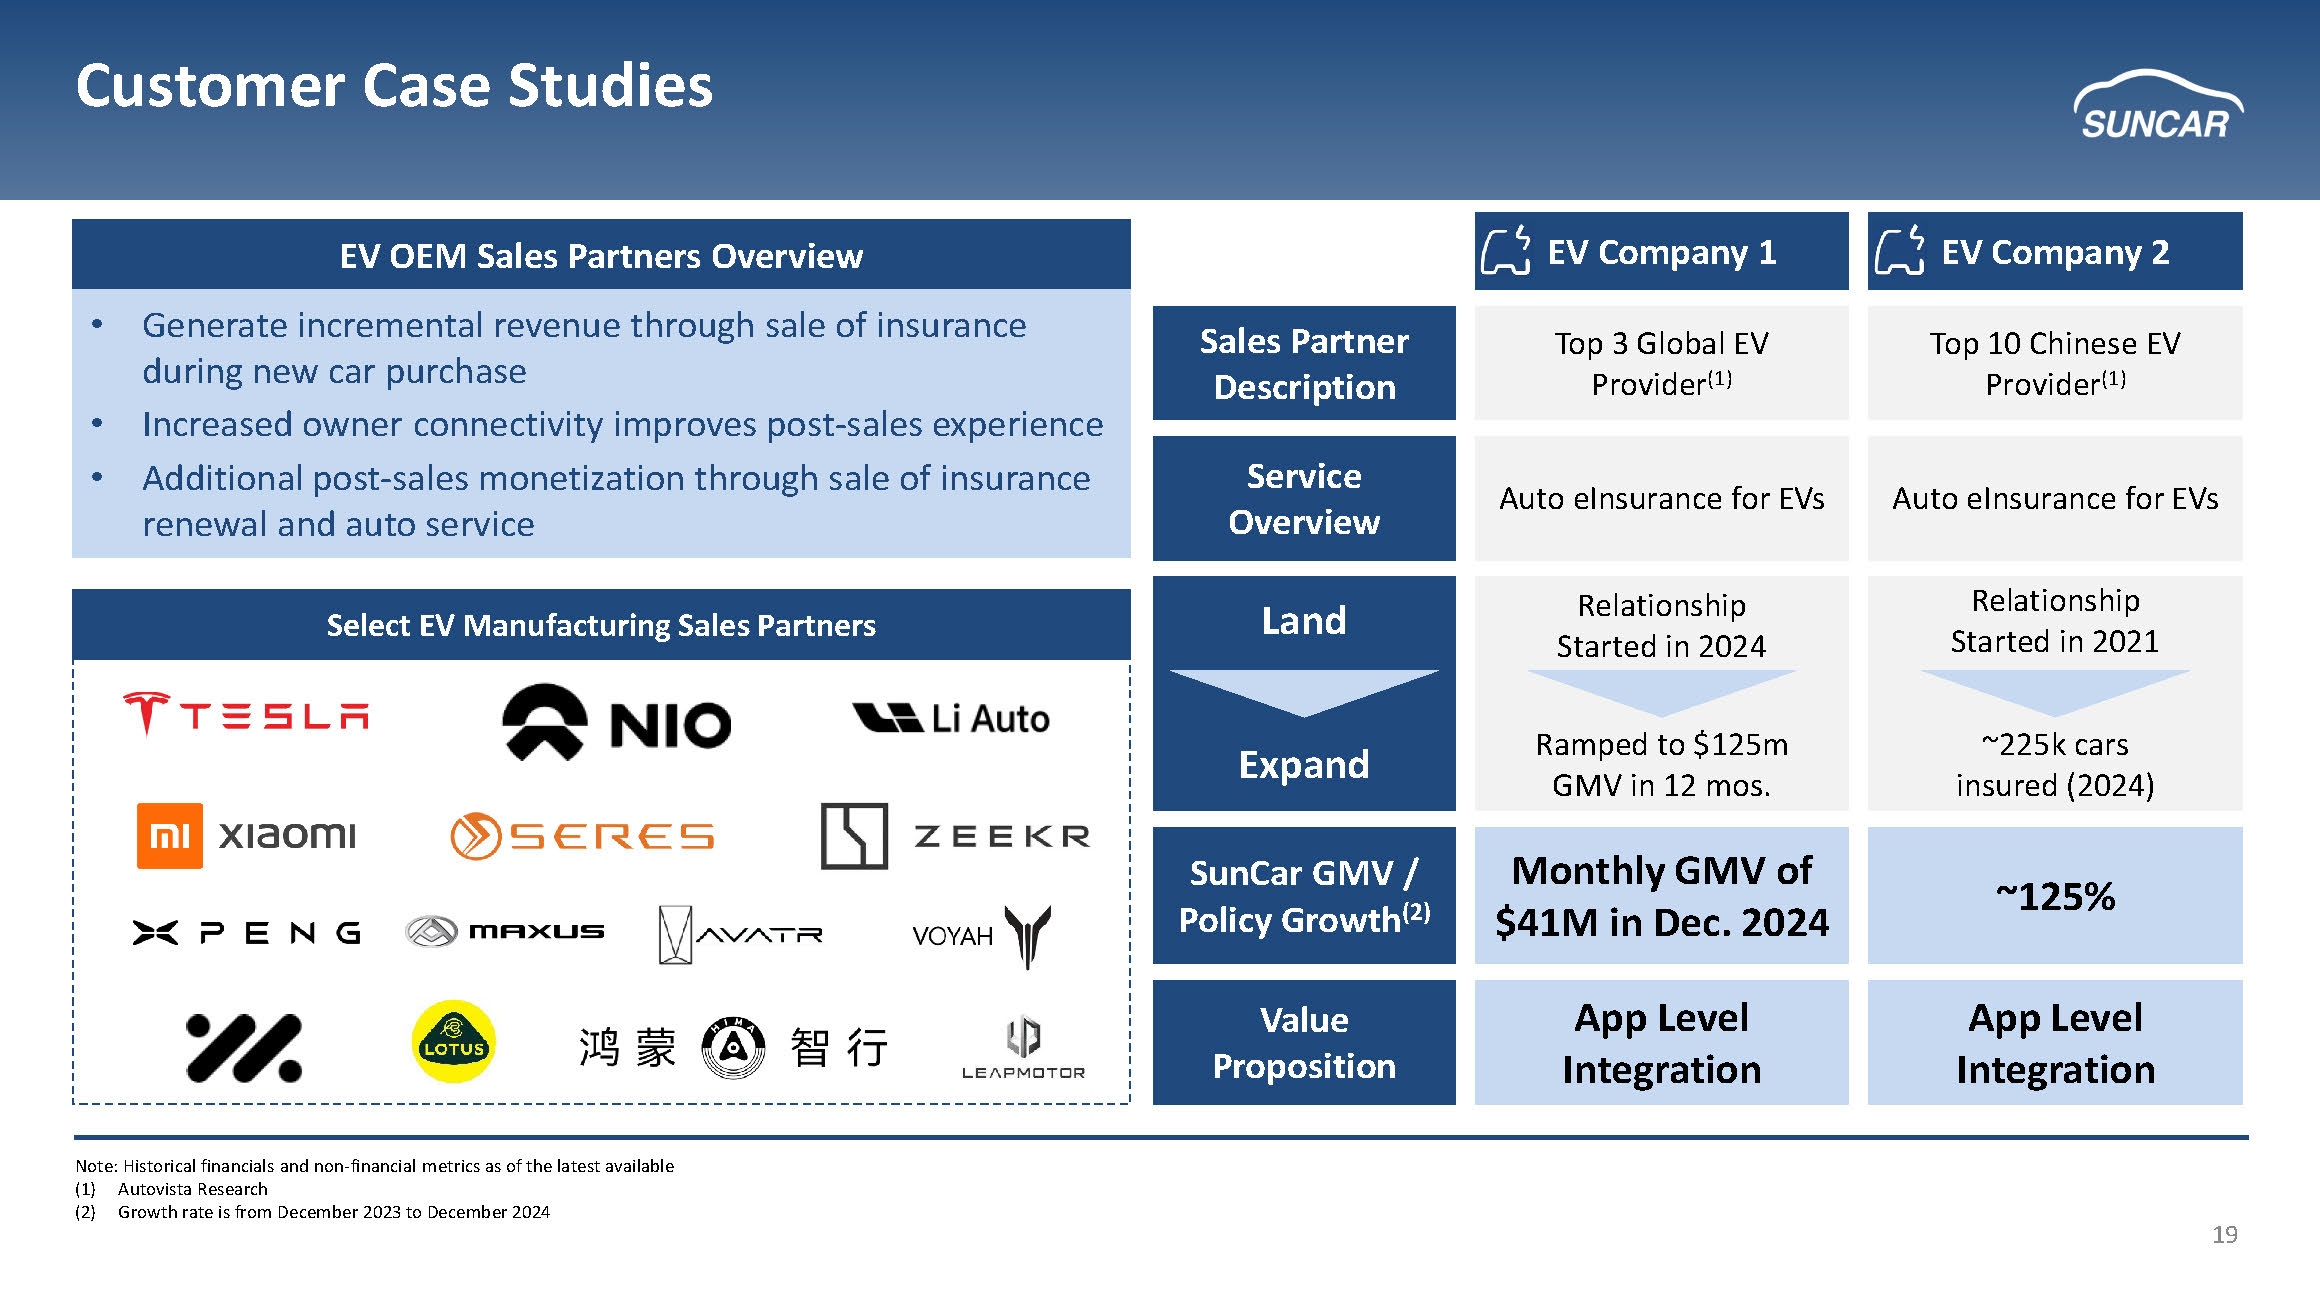
19 Customer Case Studies Note: Historical financials and non - financial metrics as of the latest available (1) Autovista Research (2) Growth rate is from December 2023 to December 2024 f EV OEM Sales Partners Overview • Generate incremental revenue through sale of insurance during new car purchase • Increased owner connectivity improves post - sales experience • Additional post - sales monetization through sale of insurance renewal and auto service Top 10 Chinese EV Provider (1) Top 3 Global EV Provider (1) Sales Partner Description Auto eInsurance for EVs Auto eInsurance for EVs Service Overview ~125% Monthly GMV of $41M in Dec. 2024 SunCar GMV / Policy Growth (2) Relationship Started in 2021 ~225k cars insured (2024) Relationship Started in 2024 Ramped to $125m GMV in 12 mos. Land Expand EV Company 1 EV Company 2 Select EV Manufacturing Sales Partners Value Proposition App Level Integration App Level Integration
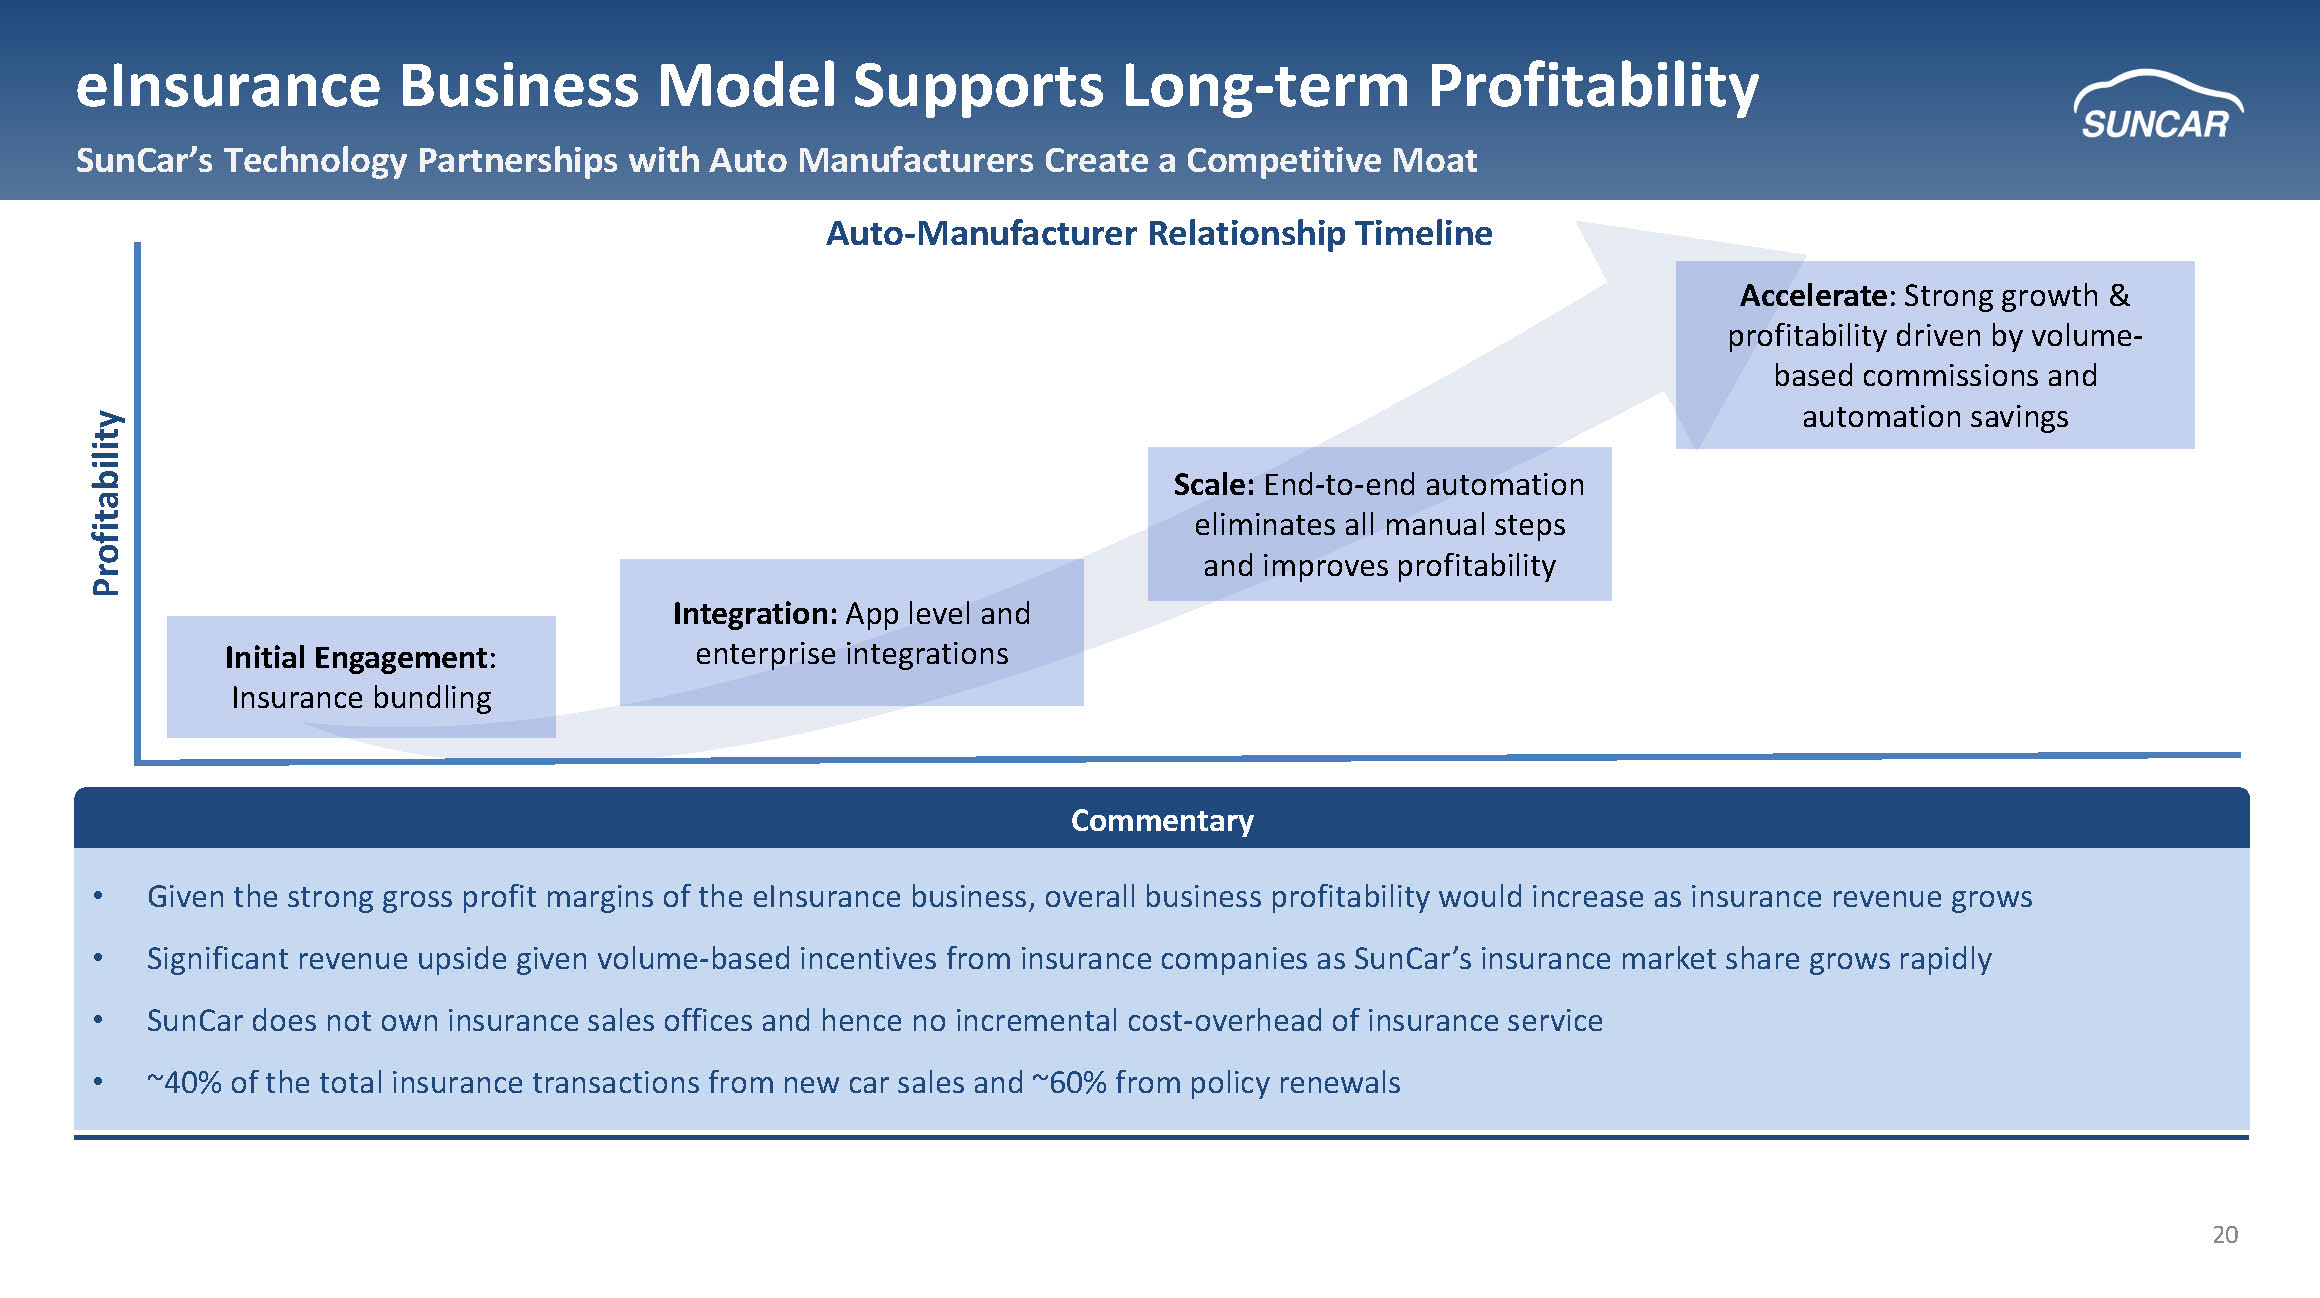
20 eInsurance Business Model Supports Long - term Profitability SunCar’s Technology Partnerships with Auto Manufacturers Create a Competitive Moat Auto - Manufacturer Relationship Timeline Profitability Initial Engagement : Insurance bundling Integration: App level and enterprise integrations Scale: End - to - end automation eliminates all manual steps and improves profitability Accelerate : Strong growth & profitability driven by volume - based commissions and automation savings Commentary • Given the strong gross profit margins of the eInsurance business, overall business profitability would increase as insurance rev enue grows • Significant revenue upside given volume - based incentives from insurance companies as SunCar’s insurance market share grows rapid ly • SunCar does not own insurance sales offices and hence no incremental cost - overhead of insurance service • ~40% of the total insurance transactions from new car sales and ~60% from policy renewals
21 Digitalized Platform for Auto Service
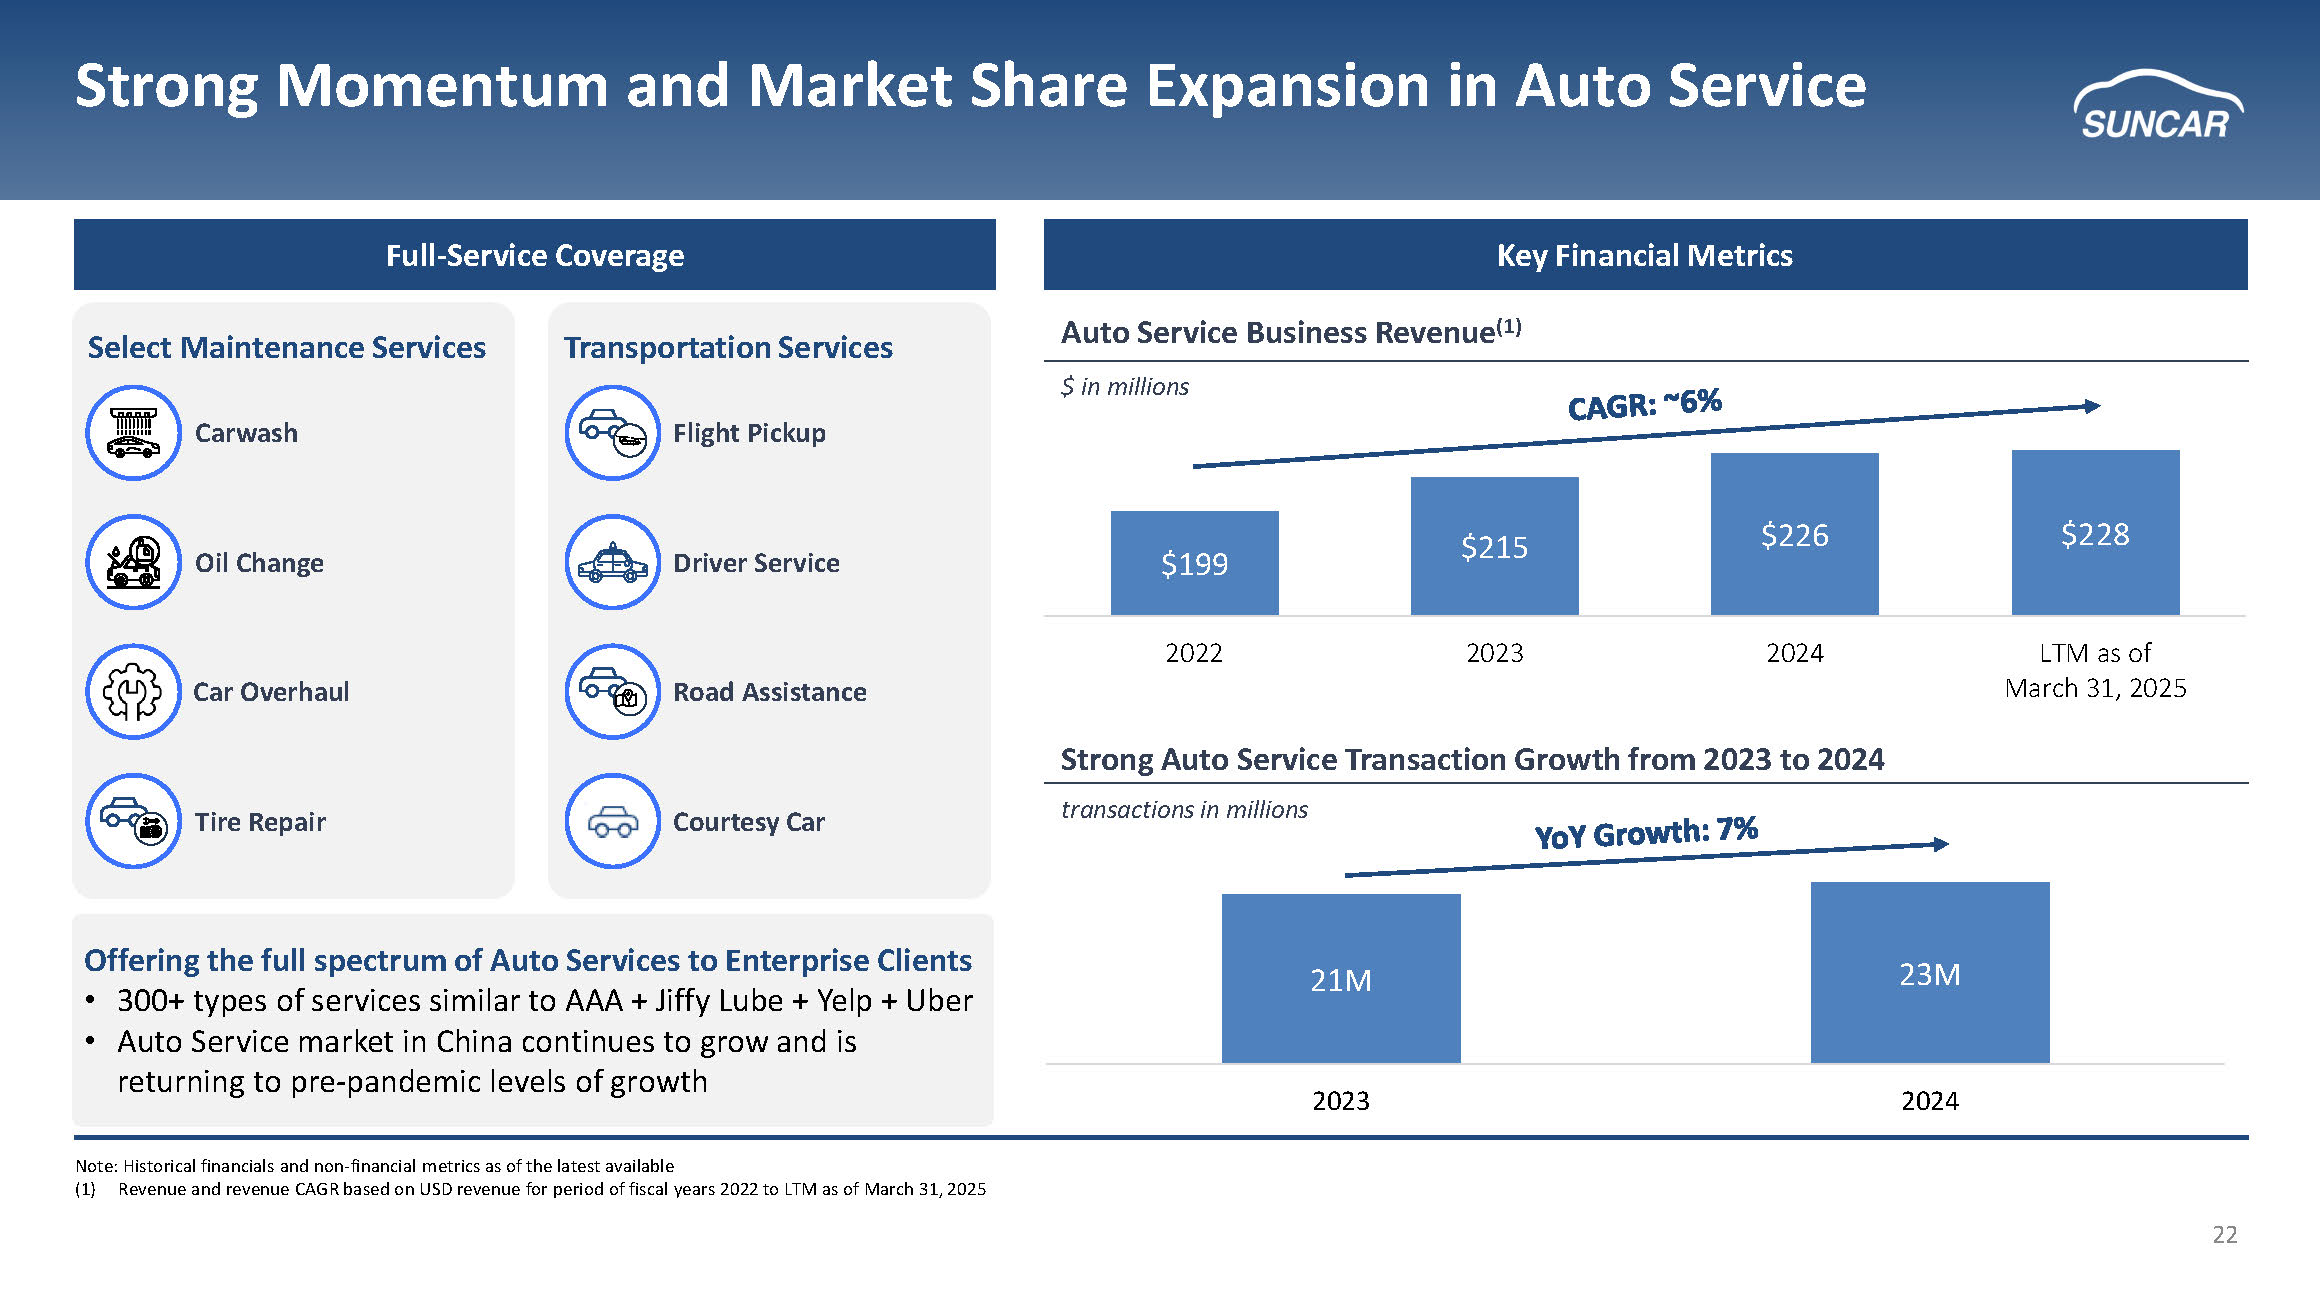
22 $199 $215 $226 $228 2022 2023 2024 LTM as of March 31, 2025 Strong Momentum and Market Share Expansion in Auto Service Full - Service Coverage Key Financial Metrics Offering the full spectrum of Auto Services to Enterprise Clients • 300+ types of services similar to AAA + Jiffy Lube + Yelp + Uber • Auto Service market in China continues to grow and is returning to pre - pandemic levels of growth Select Maintenance Services Transportation Services Carwash Flight Pickup Oil Change Driver Service Courtesy Car Road Assistance Tire Repair Car Overhaul Strong Auto Service Transaction Growth from 2023 to 2024 Auto Service Business Revenue (1) Note: Historical financials and non - financial metrics as of the latest available (1) Revenue and revenue CAGR based on USD revenue for period of fiscal years 2022 to LTM as of March 31, 2025 $ in millions 21 M 23 M 2023 2024 transactions in millions
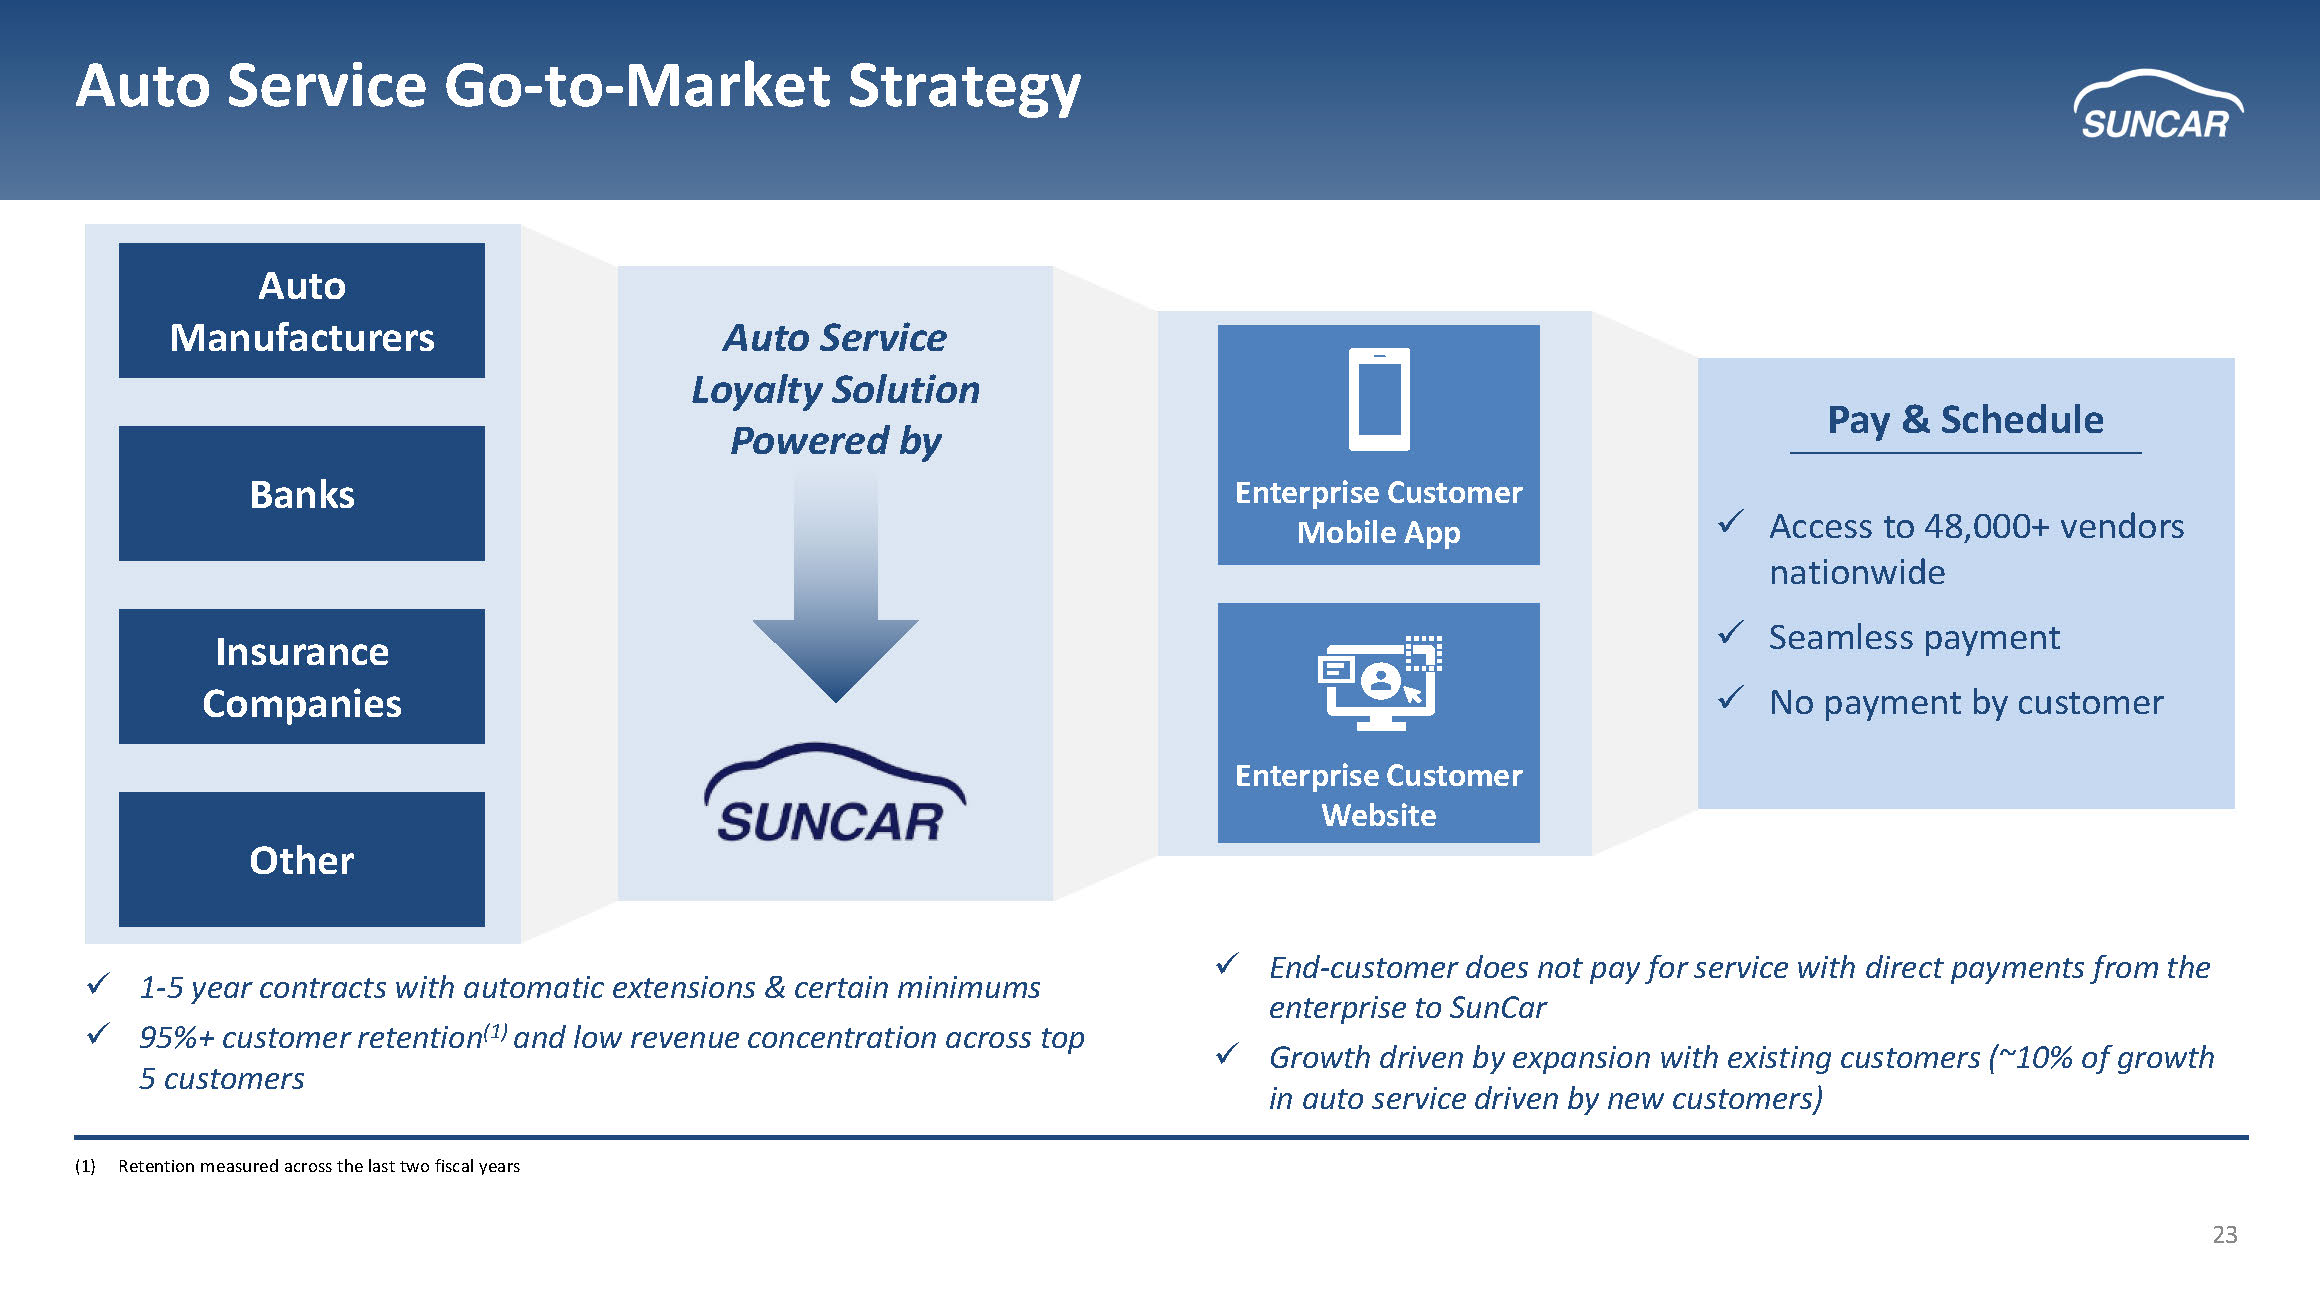
23 Auto Service Go - to - Market Strategy x 1 - 5 year contracts with automatic extensions & certain minimums x 95%+ customer retention (1) and low revenue concentration across top 5 customers x End - customer does not pay for service with direct payments from the enterprise to SunCar x Growth driven by expansion with existing customers (~10% of growth in auto service driven by new customers) Auto Manufacturers Banks Insurance Companies Other Pay & Schedule x Access to 48,000+ vendors nationwide x Seamless payment x No payment by customer Enterprise Customer Mobile App Enterprise Customer Website Auto Service Loyalty Solution Powered by (1) Retention measured across the last two fiscal years
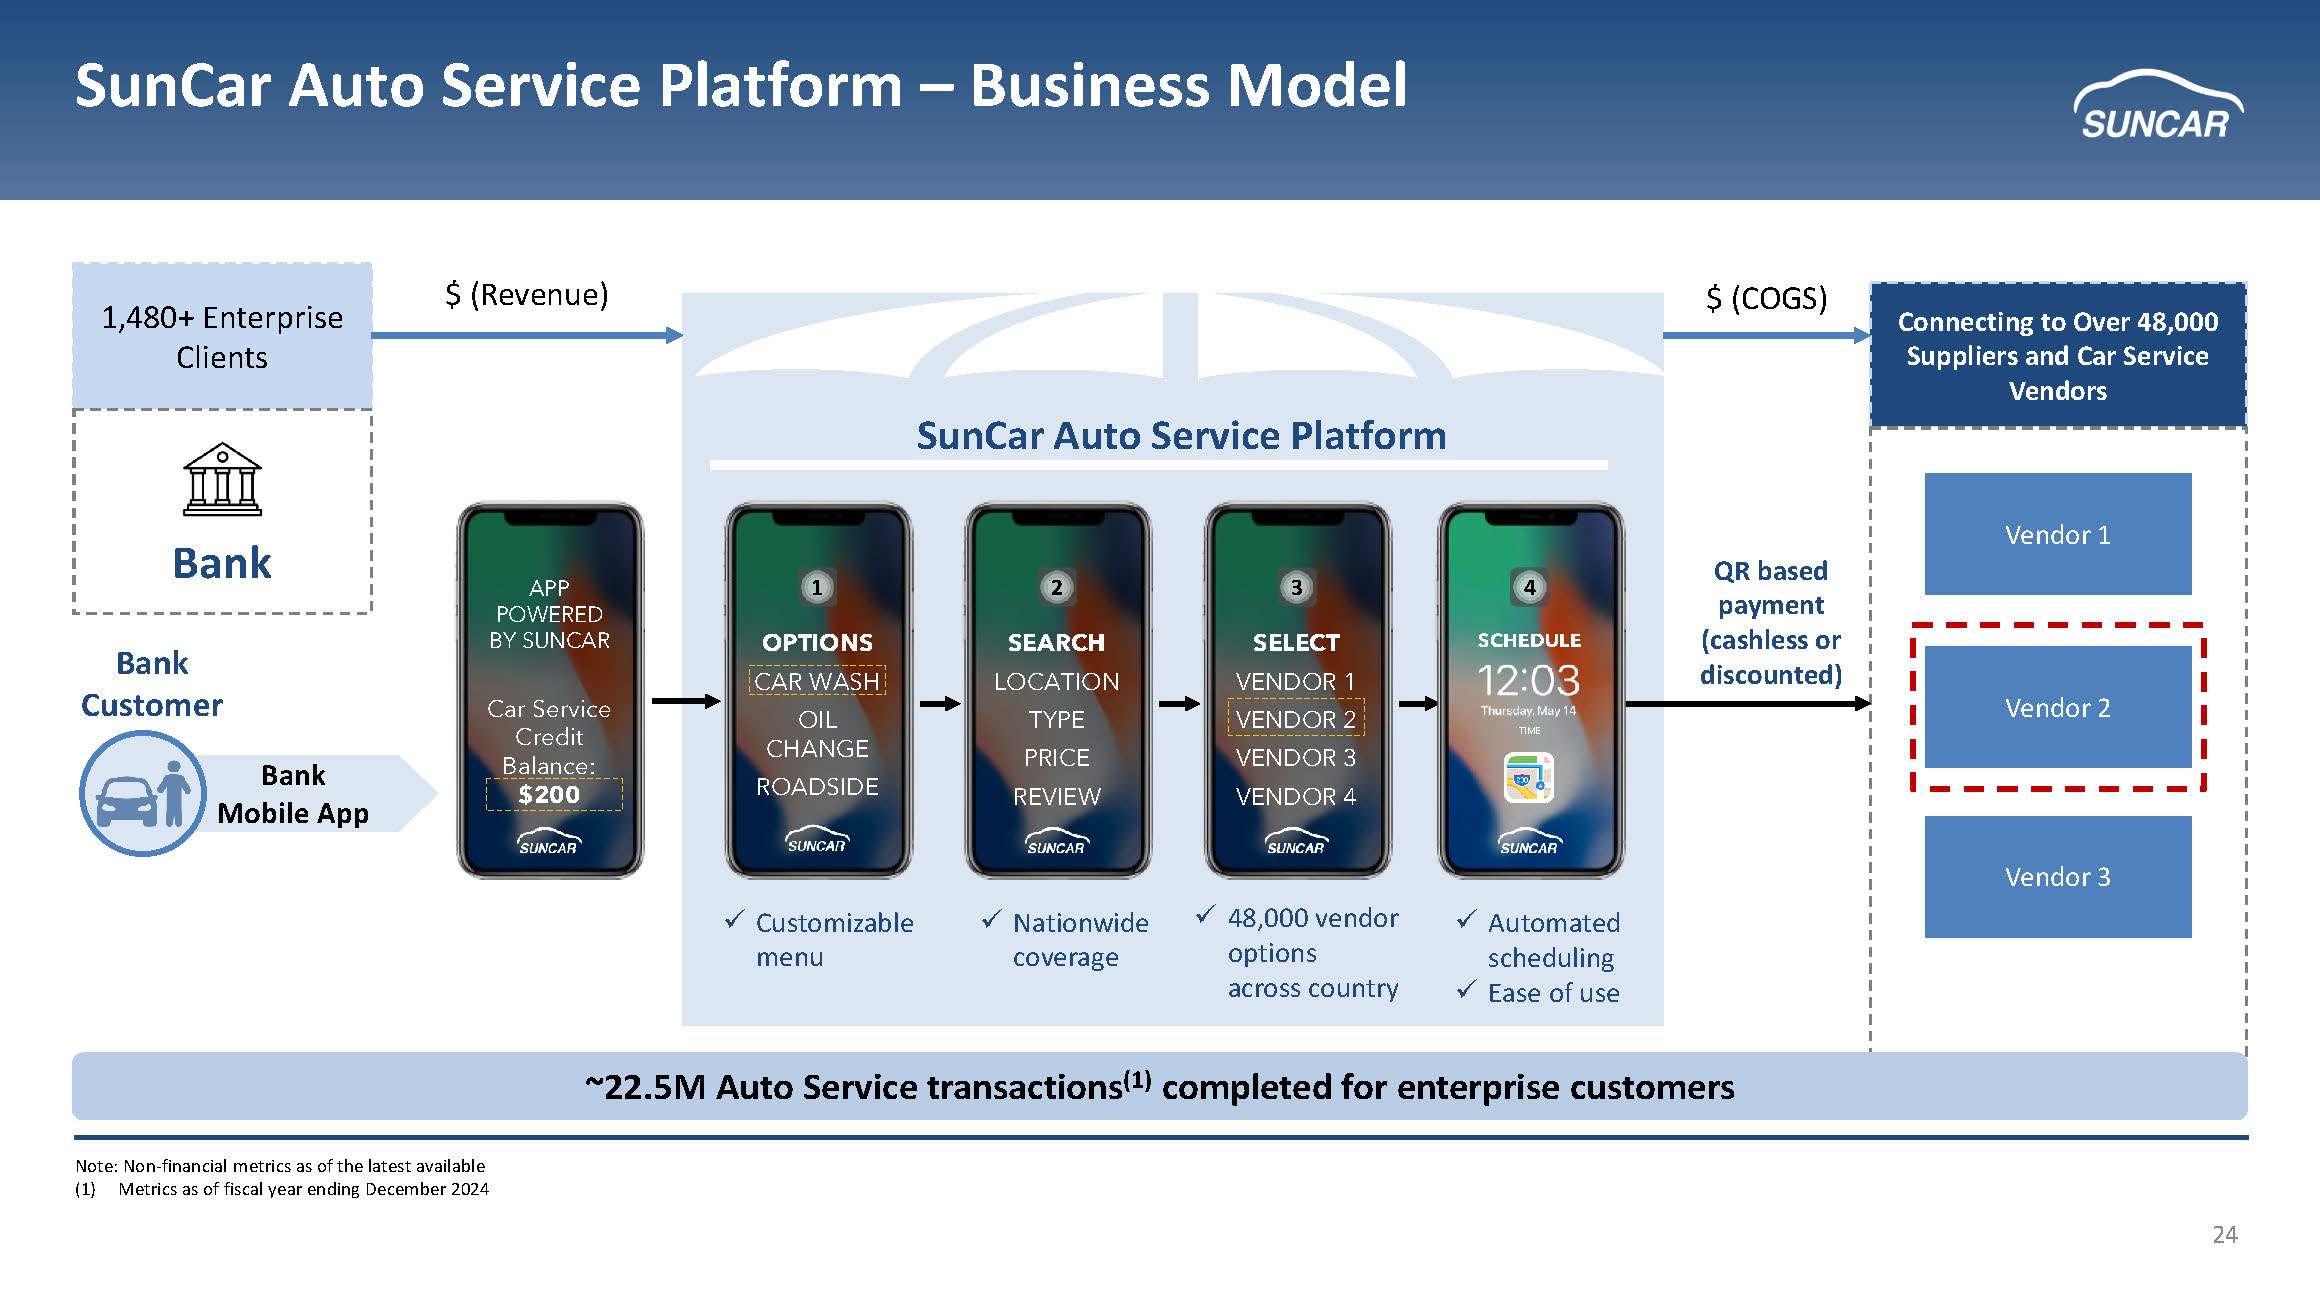
24 SunCar Auto Service Platform – Business Model Connecting to Over 48,000 Suppliers and Car Service Vendors 1,480+ Enterprise Clients Bank Bank Customer SunCar Auto Service Platform $ (Revenue) $ (COGS) Vendor 1 Vendor 2 Vendor 3 x Customizable menu x Nationwide coverage x 48,000 vendor options across country x Automated scheduling x Ease of use QR based payment (cashless or discounted) Bank Mobile App APP POWERED BY SUNCAR Car Service Credit Balance: $200 OPTIONS CAR WASH OIL CHANGE ROADSIDE SEARCH LOCATION TYPE PRICE REVIEW SELECT VENDOR 1 VENDOR 2 VENDOR 3 VENDOR 4 1 2 3 SCHEDULE 4 TIME ~22.5M Auto Service transactions (1) completed for enterprise customers Note: Non - financial metrics as of the latest available (1) Metrics as of fiscal year ending December 2024
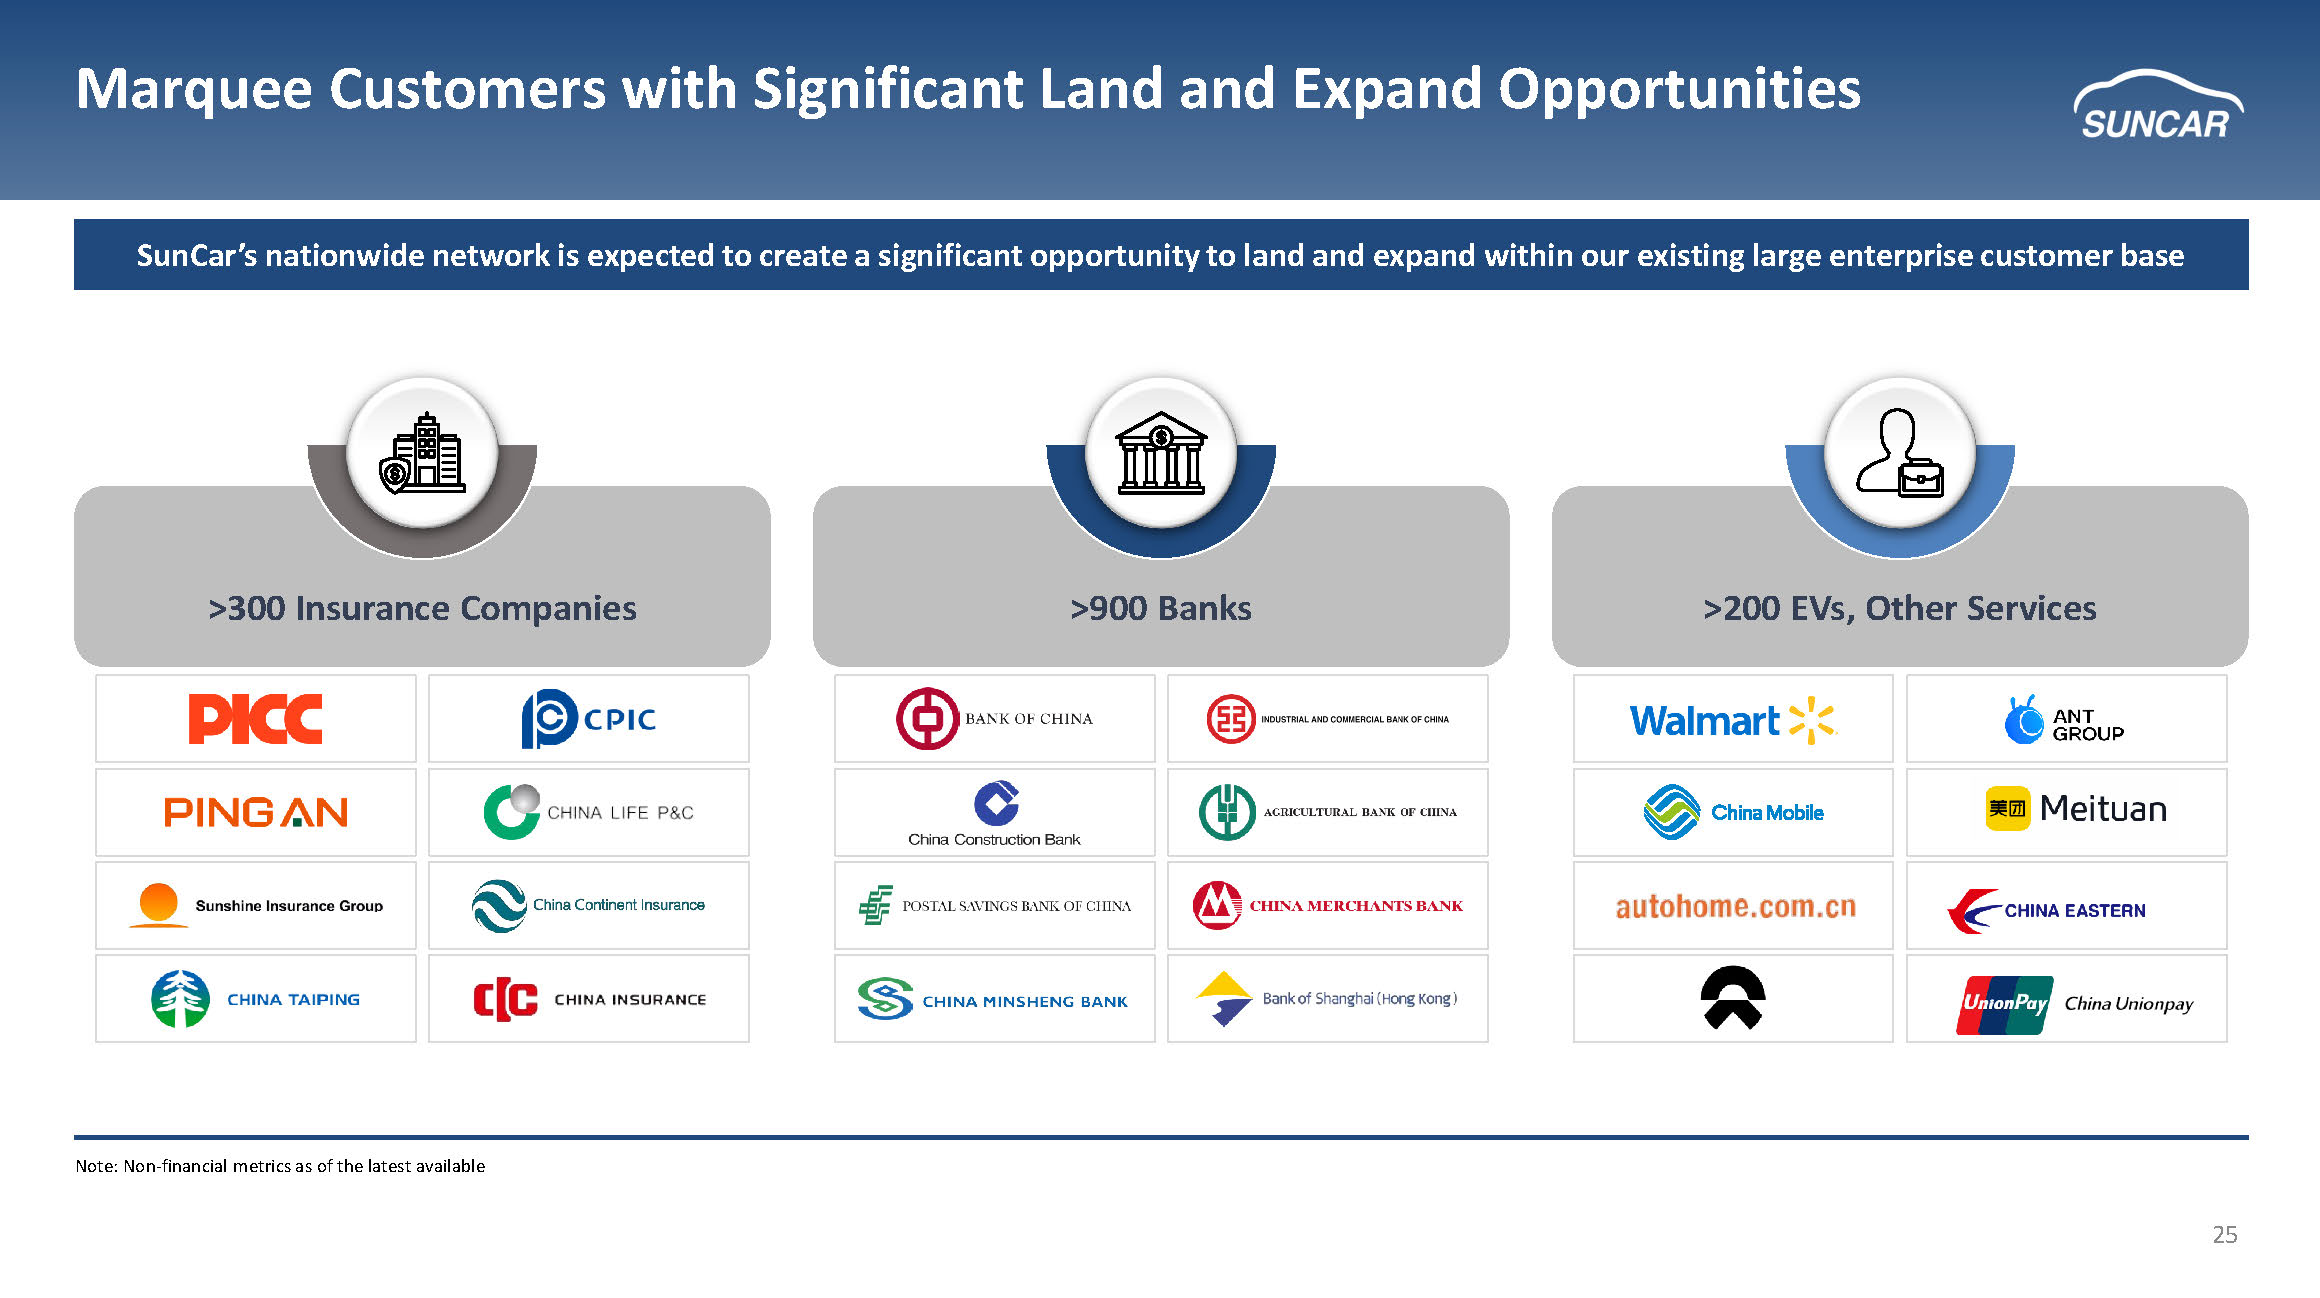
25 >300 Insurance Companies Marquee Customers with Significant Land and Expand Opportunities SunCar’s nationwide network is expected to create a significant opportunity to land and expand within our existing large ente rpr ise customer base >900 Banks >200 EVs, Other Services Note: Non - financial metrics as of the latest available

26 Financial Summary
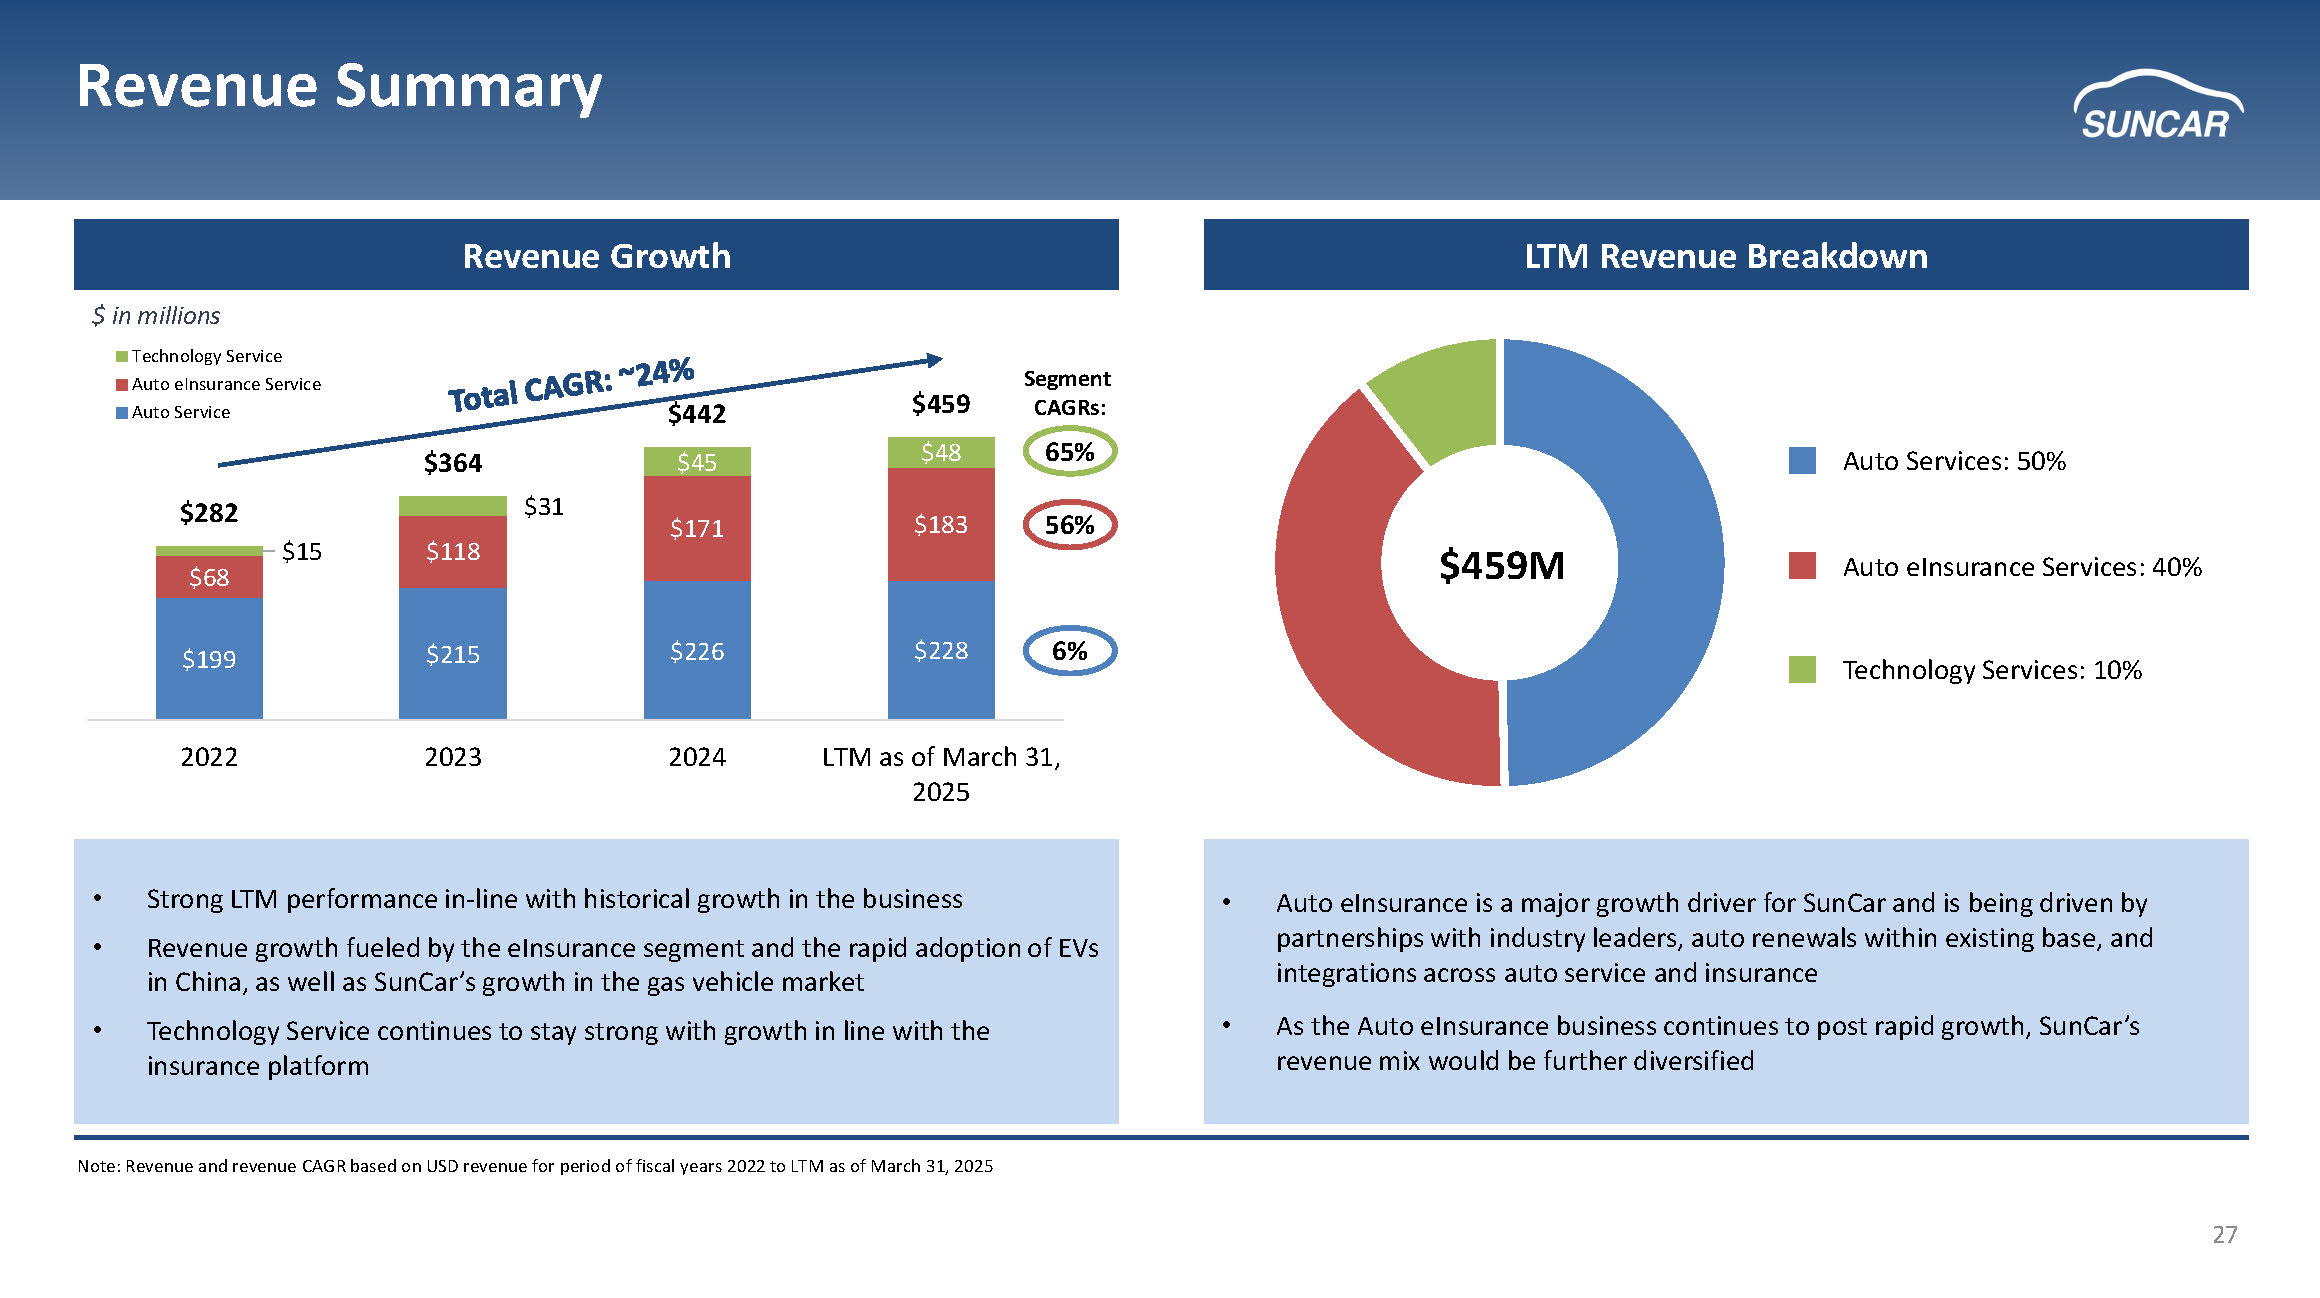
27 Revenue Summary Note: Revenue and revenue CAGR based on USD revenue for period of fiscal years 2022 to LTM as of March 31, 2025 Revenue Growth $ in millions LTM Revenue Breakdown $459M Technology Services: 10% Auto eInsurance Services: 40% Auto Services: 50% • Strong LTM performance in - line with historical growth in the business • Revenue growth fueled by the eInsurance segment and the rapid adoption of EVs in China, as well as SunCar’s growth in the gas vehicle market • Technology Service continues to stay strong with growth in line with the insurance platform • Auto eInsurance is a major growth driver for SunCar and is being driven by partnerships with industry leaders, auto renewals within existing base, and integrations across auto service and insurance • As the Auto eInsurance business continues to post rapid growth, SunCar’s revenue mix would be further diversified $199 $215 $226 $228 $68 $118 $171 $183 $15 $31 $45 $48 $282 $364 $442 $459 2022 2023 2024 LTM as of March 31, 2025 Technology Service Auto eInsurance Service Auto Service Segment CAGRs: 65% 56% 6%
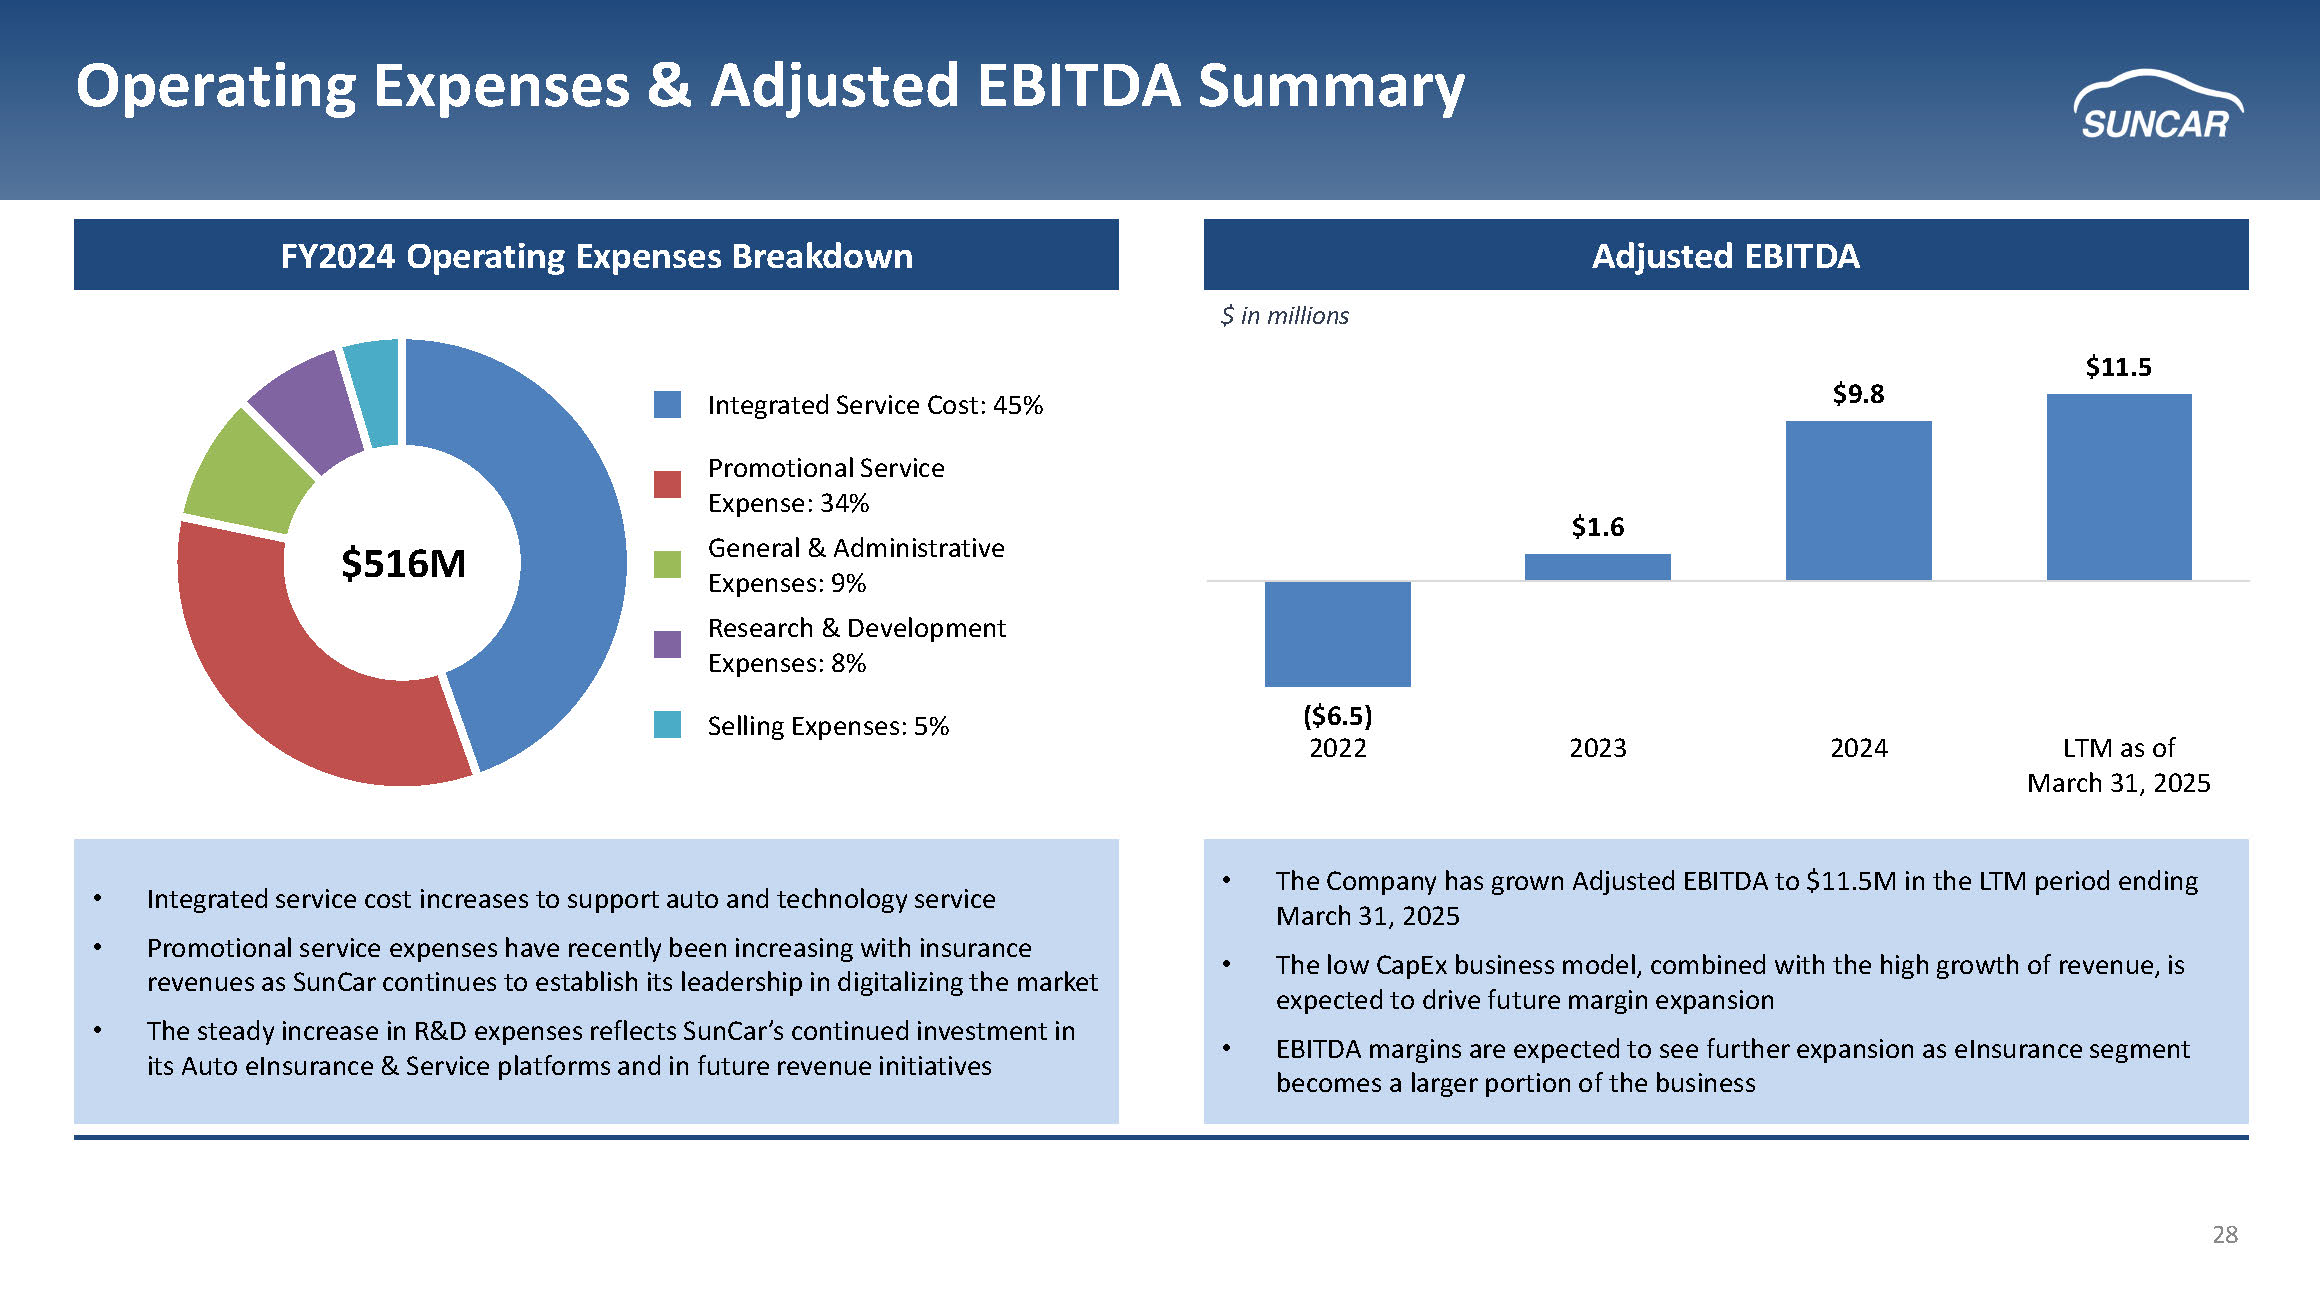
28 Operating Expenses & Adjusted EBITDA Summary FY2024 Operating Expenses Breakdown Adjusted EBITDA $ in millions • Integrated service cost increases to support auto and technology service • Promotional service expenses have recently been increasing with insurance revenues as SunCar continues to establish its leadership in digitalizing the market • The steady increase in R&D expenses reflects SunCar’s continued investment in its Auto eInsurance & Service platforms and in future revenue initiatives • The Company has grown Adjusted EBITDA to $11.5M in the LTM period ending March 31, 2025 • The low CapEx business model, combined with the high growth of revenue, is expected to drive future margin expansion • EBITDA margins are expected to see further expansion as eInsurance segment becomes a larger portion of the business Research & Development Expenses: 8% General & Administrative Expenses: 9% Integrated Service Cost: 45% Promotional Service Expense: 34% Selling Expenses: 5% $516M ($6.5) $1.6 $9.8 $11.5 2022 2023 2024 LTM as of March 31, 2025
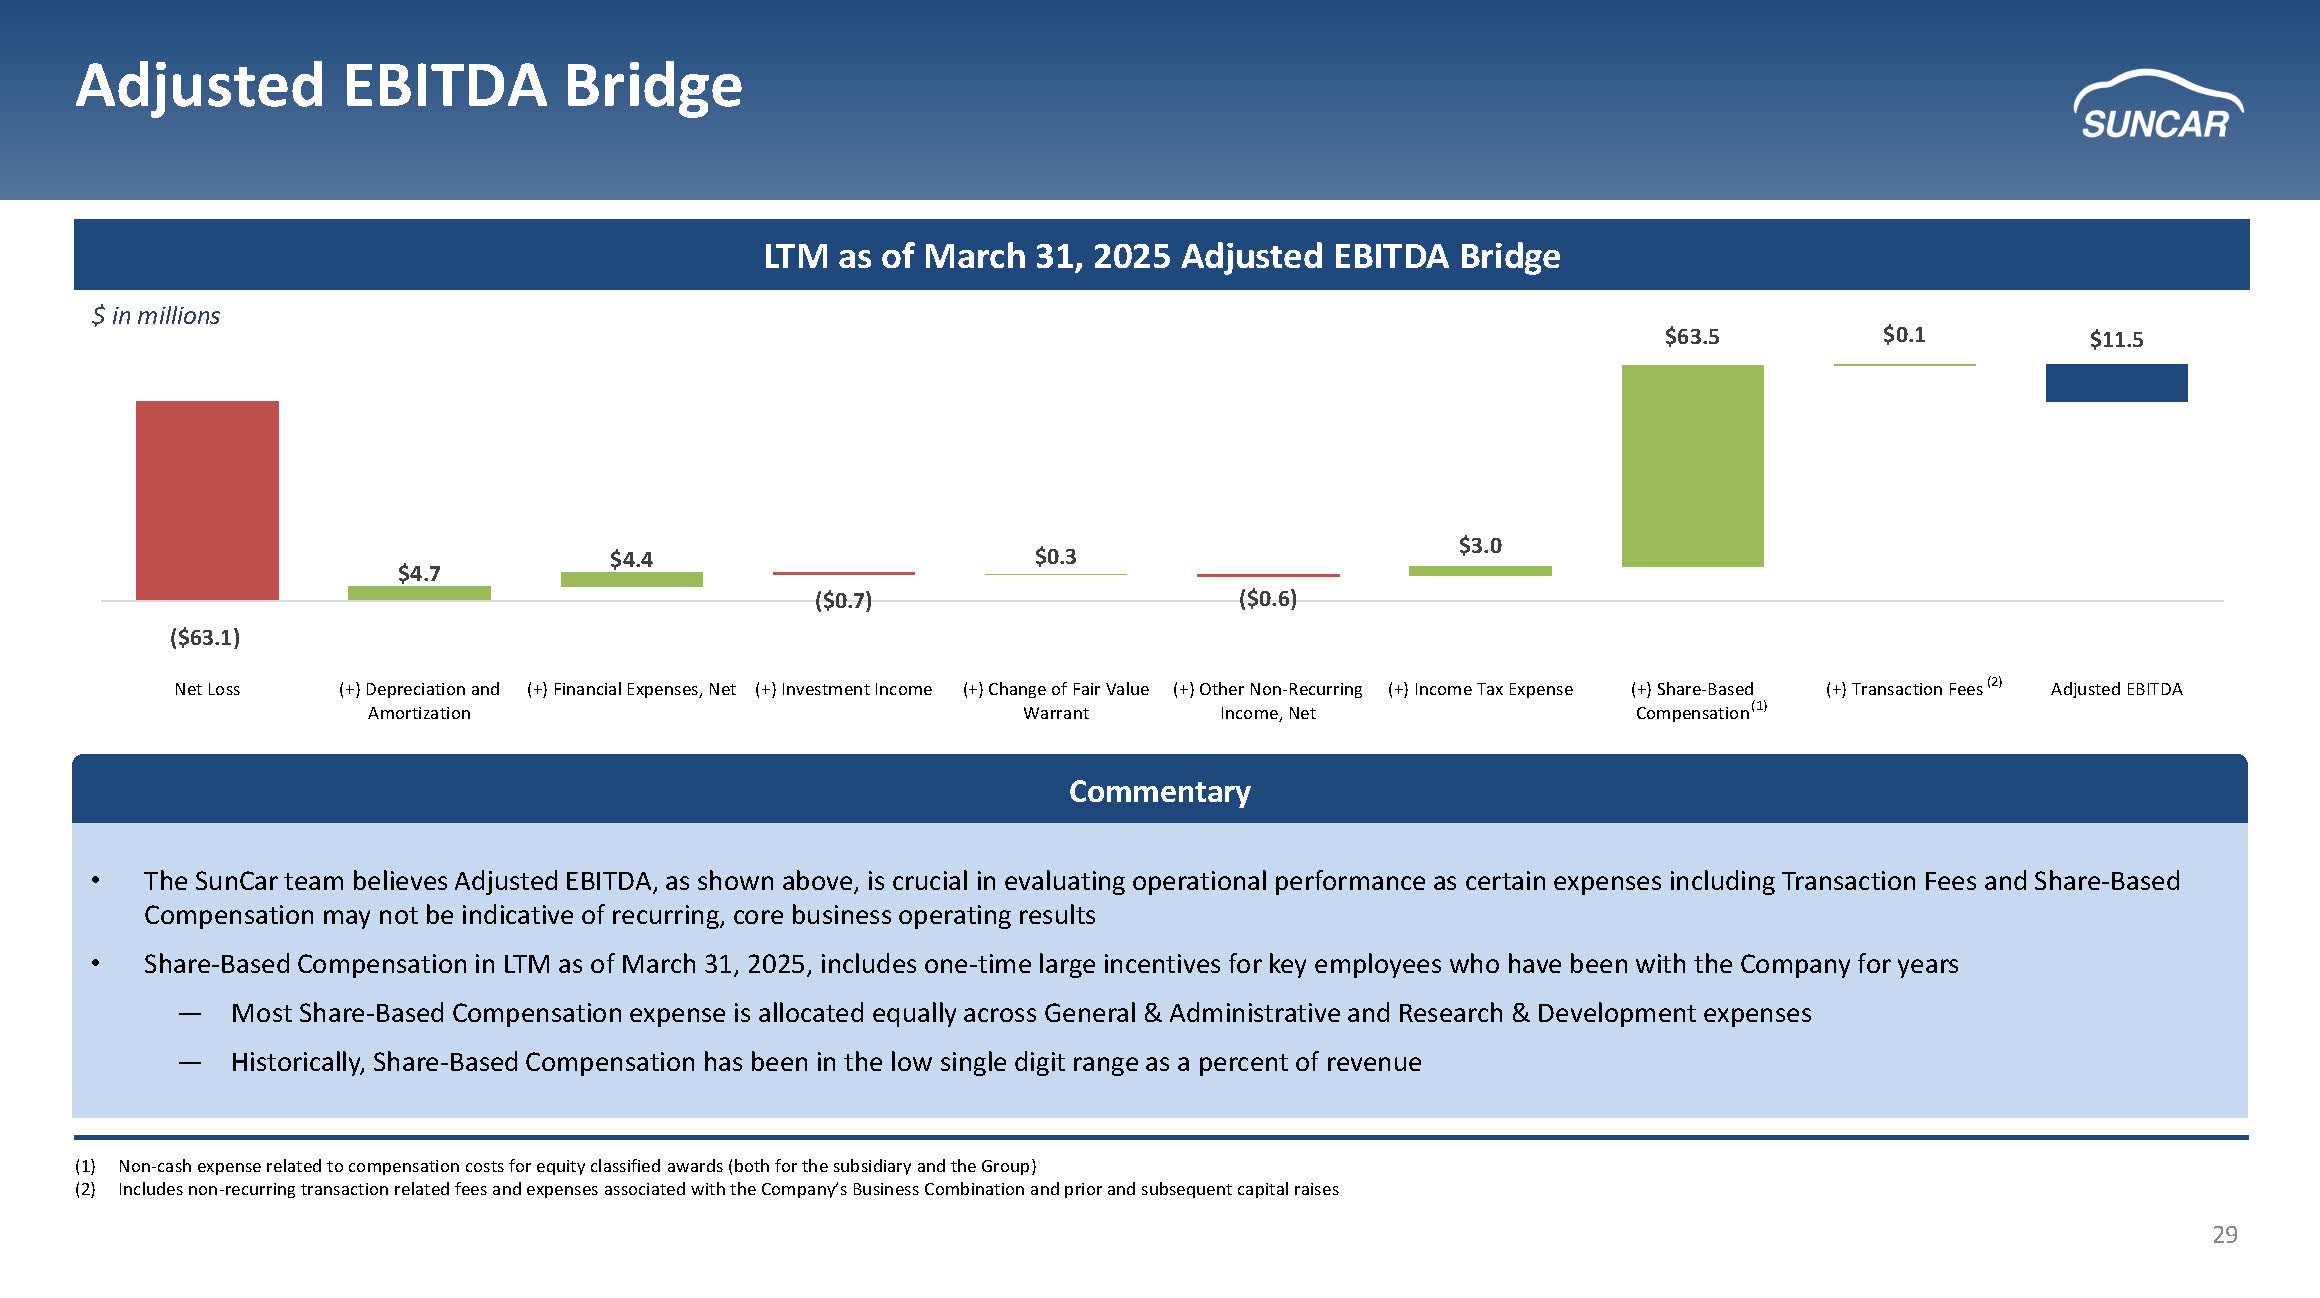
29 Adjusted EBITDA Bridge Commentary (1) Non - cash expense related to compensation costs for equity classified awards (both for the subsidiary and the Group) (2) Includes non - recurring transaction related fees and expenses associated with the Company’s Business Combination and prior and su bsequent capital raises LTM as of March 31, 2025 Adjusted EBITDA Bridge $ in millions • The SunCar team believes Adjusted EBITDA, as shown above, is crucial in evaluating operational performance as certain expense s i ncluding Transaction Fees and Share - Based Compensation may not be indicative of recurring, core business operating results • Share - Based Compensation in LTM as of March 31, 2025, includes one - time large incentives for key employees who have been with th e Company for years ― Most Share - Based Compensation expense is allocated equally across General & Administrative and Research & Development expenses ― Historically, Share - Based Compensation has been in the low single digit range as a percent of revenue ($63.1) $4.7 $4.4 ($0.7) $0.3 ($0.6) $3.0 $63.5 $0.1 $11.5 Net Loss (+) Depreciation and Amortization (+) Financial Expenses, Net (+) Investment Income (+) Change of Fair Value Warrant (+) Other Non-Recurring Income, Net (+) Income Tax Expense (+) Share-Based Compensation (+) Transaction Fees Adjusted EBITDA (1) (2)
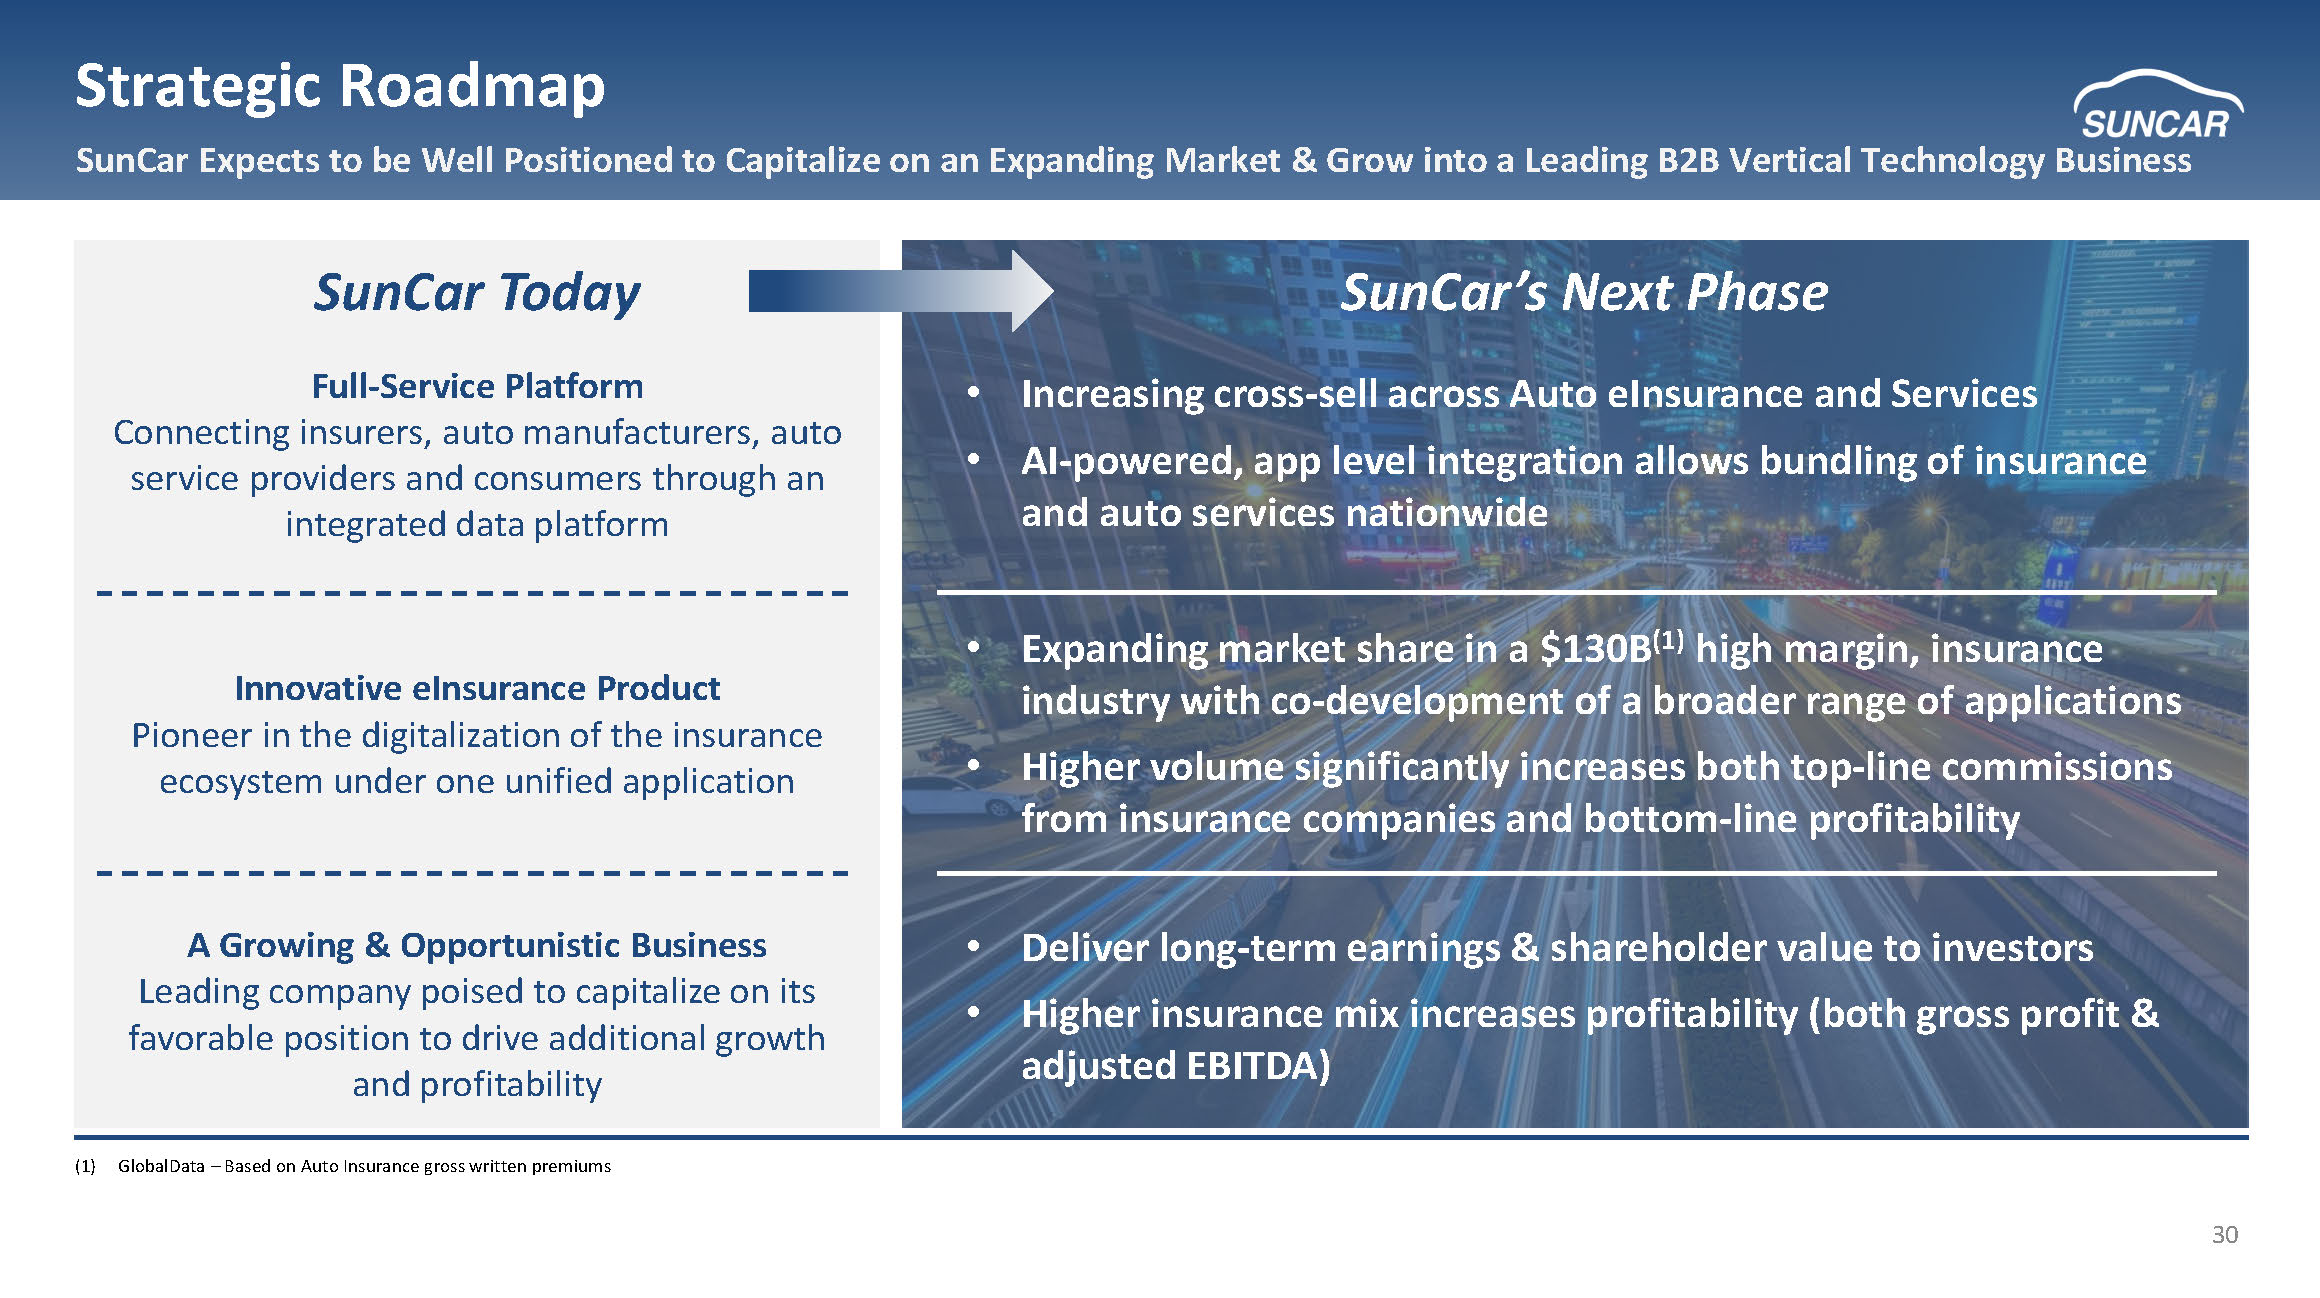
30 Strategic Roadmap SunCar Expects to be Well Positioned to Capitalize on an Expanding Market & Grow into a Leading B2B Vertical Technology Busin ess SunCar’s Next Phase • Expanding market share in a $130B (1) high margin, insurance industry with co - development of a broader range of applications • Higher volume significantly increases both top - line commissions from insurance companies and bottom - line profitability • Deliver long - term earnings & shareholder value to investors • Higher insurance mix increases profitability (both gross profit & adjusted EBITDA) SunCar Today Innovative eInsurance Product Pioneer in the digitalization of the insurance ecosystem under one unified application A Growing & Opportunistic Business Leading company poised to capitalize on its favorable position to drive additional growth and profitability Full - Service Platform Connecting insurers, auto manufacturers, auto service providers and consumers through an integrated data platform • Increasing cross - sell across Auto eInsurance and Services • AI - powered, app level integration allows bundling of insurance and auto services nationwide (1) GlobalData – Based on Auto Insurance gross written premiums

31 Appendix
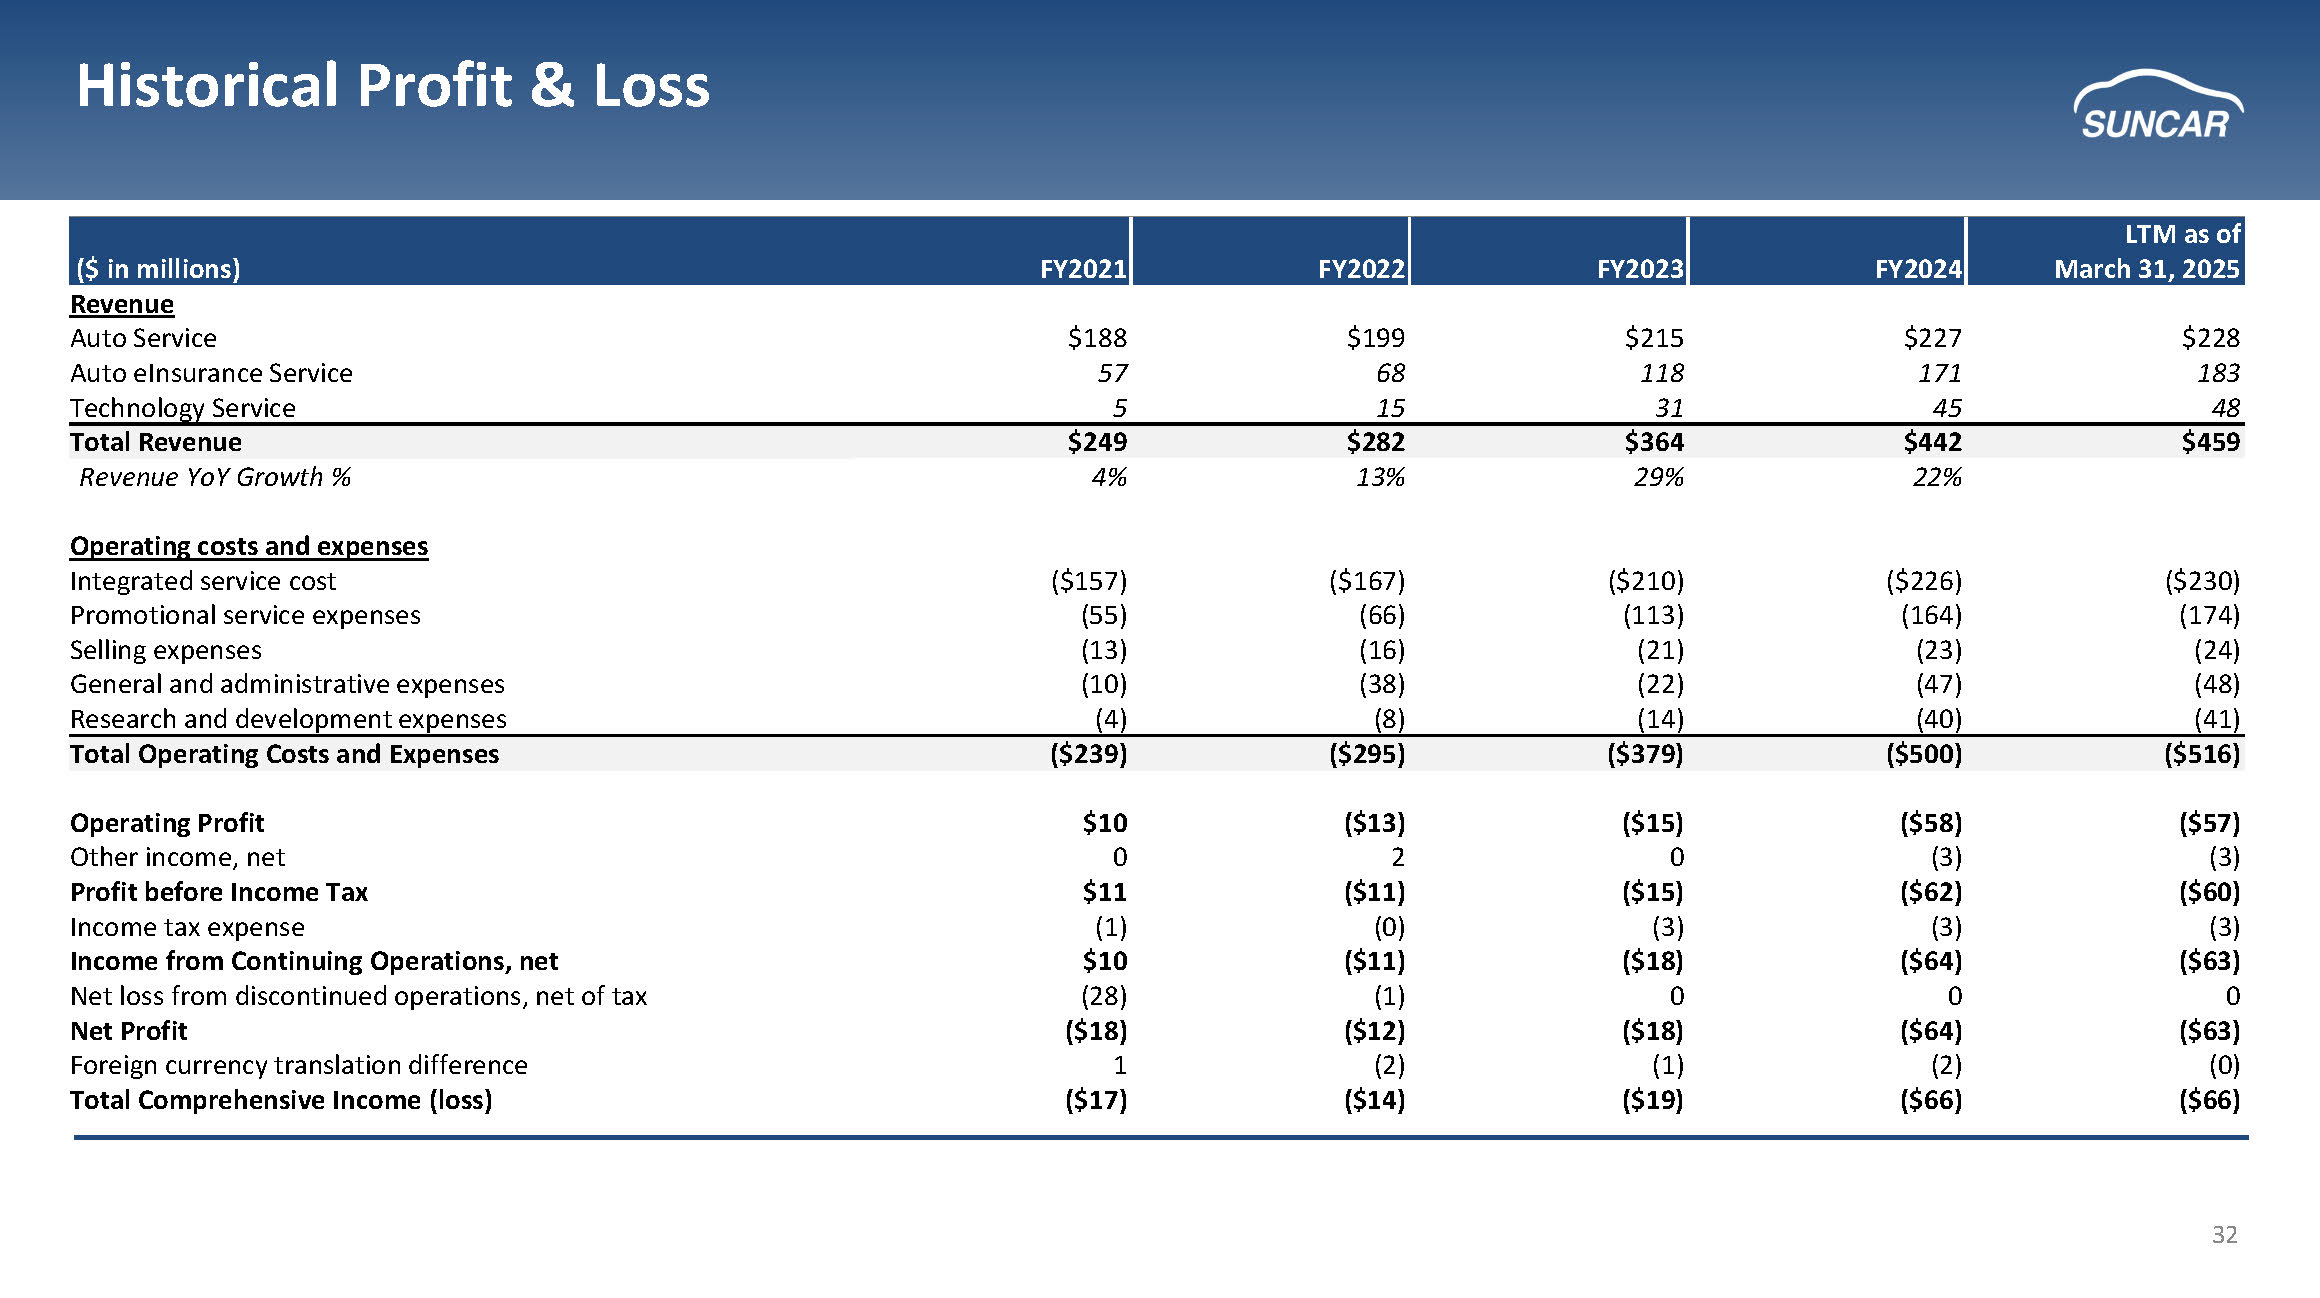
32 LTM as of March 31, 2025 FY2024 FY2023 FY2022 FY2021 ($ in millions) Revenue $228 $227 $215 $199 $188 Auto Service 183 171 118 68 57 Auto eInsurance Service 48 45 31 15 5 Technology Service $459 $442 $364 $282 $249 Total Revenue 22% 29% 13% 4% Revenue YoY Growth % Operating costs and expenses ($230) ($226) ($210) ($167) ($157) Integrated service cost (174) (164) (113) (66) (55) Promotional service expenses (24) (23) (21) (16) (13) Selling expenses (48) (47) (22) (38) (10) General and administrative expenses (41) (40) (14) (8) (4) Research and development expenses ($516) ($500) ($379) ($295) ($239) Total Operating Costs and Expenses ($57) ($58) ($15) ($13) $10 Operating Profit (3) (3) 0 2 0 Other income, net ($60) ($62) ($15) ($11) $11 Profit before Income Tax (3) (3) (3) (0) (1) Income tax expense ($63) ($64) ($18) ($11) $10 Income from Continuing Operations, net 0 0 0 (1) (28) Net loss from discontinued operations, net of tax ($63) ($64) ($18) ($12) ($18) Net Profit (0) (2) (1) (2) 1 Foreign currency translation difference ($66) ($66) ($19) ($14) ($17) Total Comprehensive Income (loss) Historical Profit & Loss
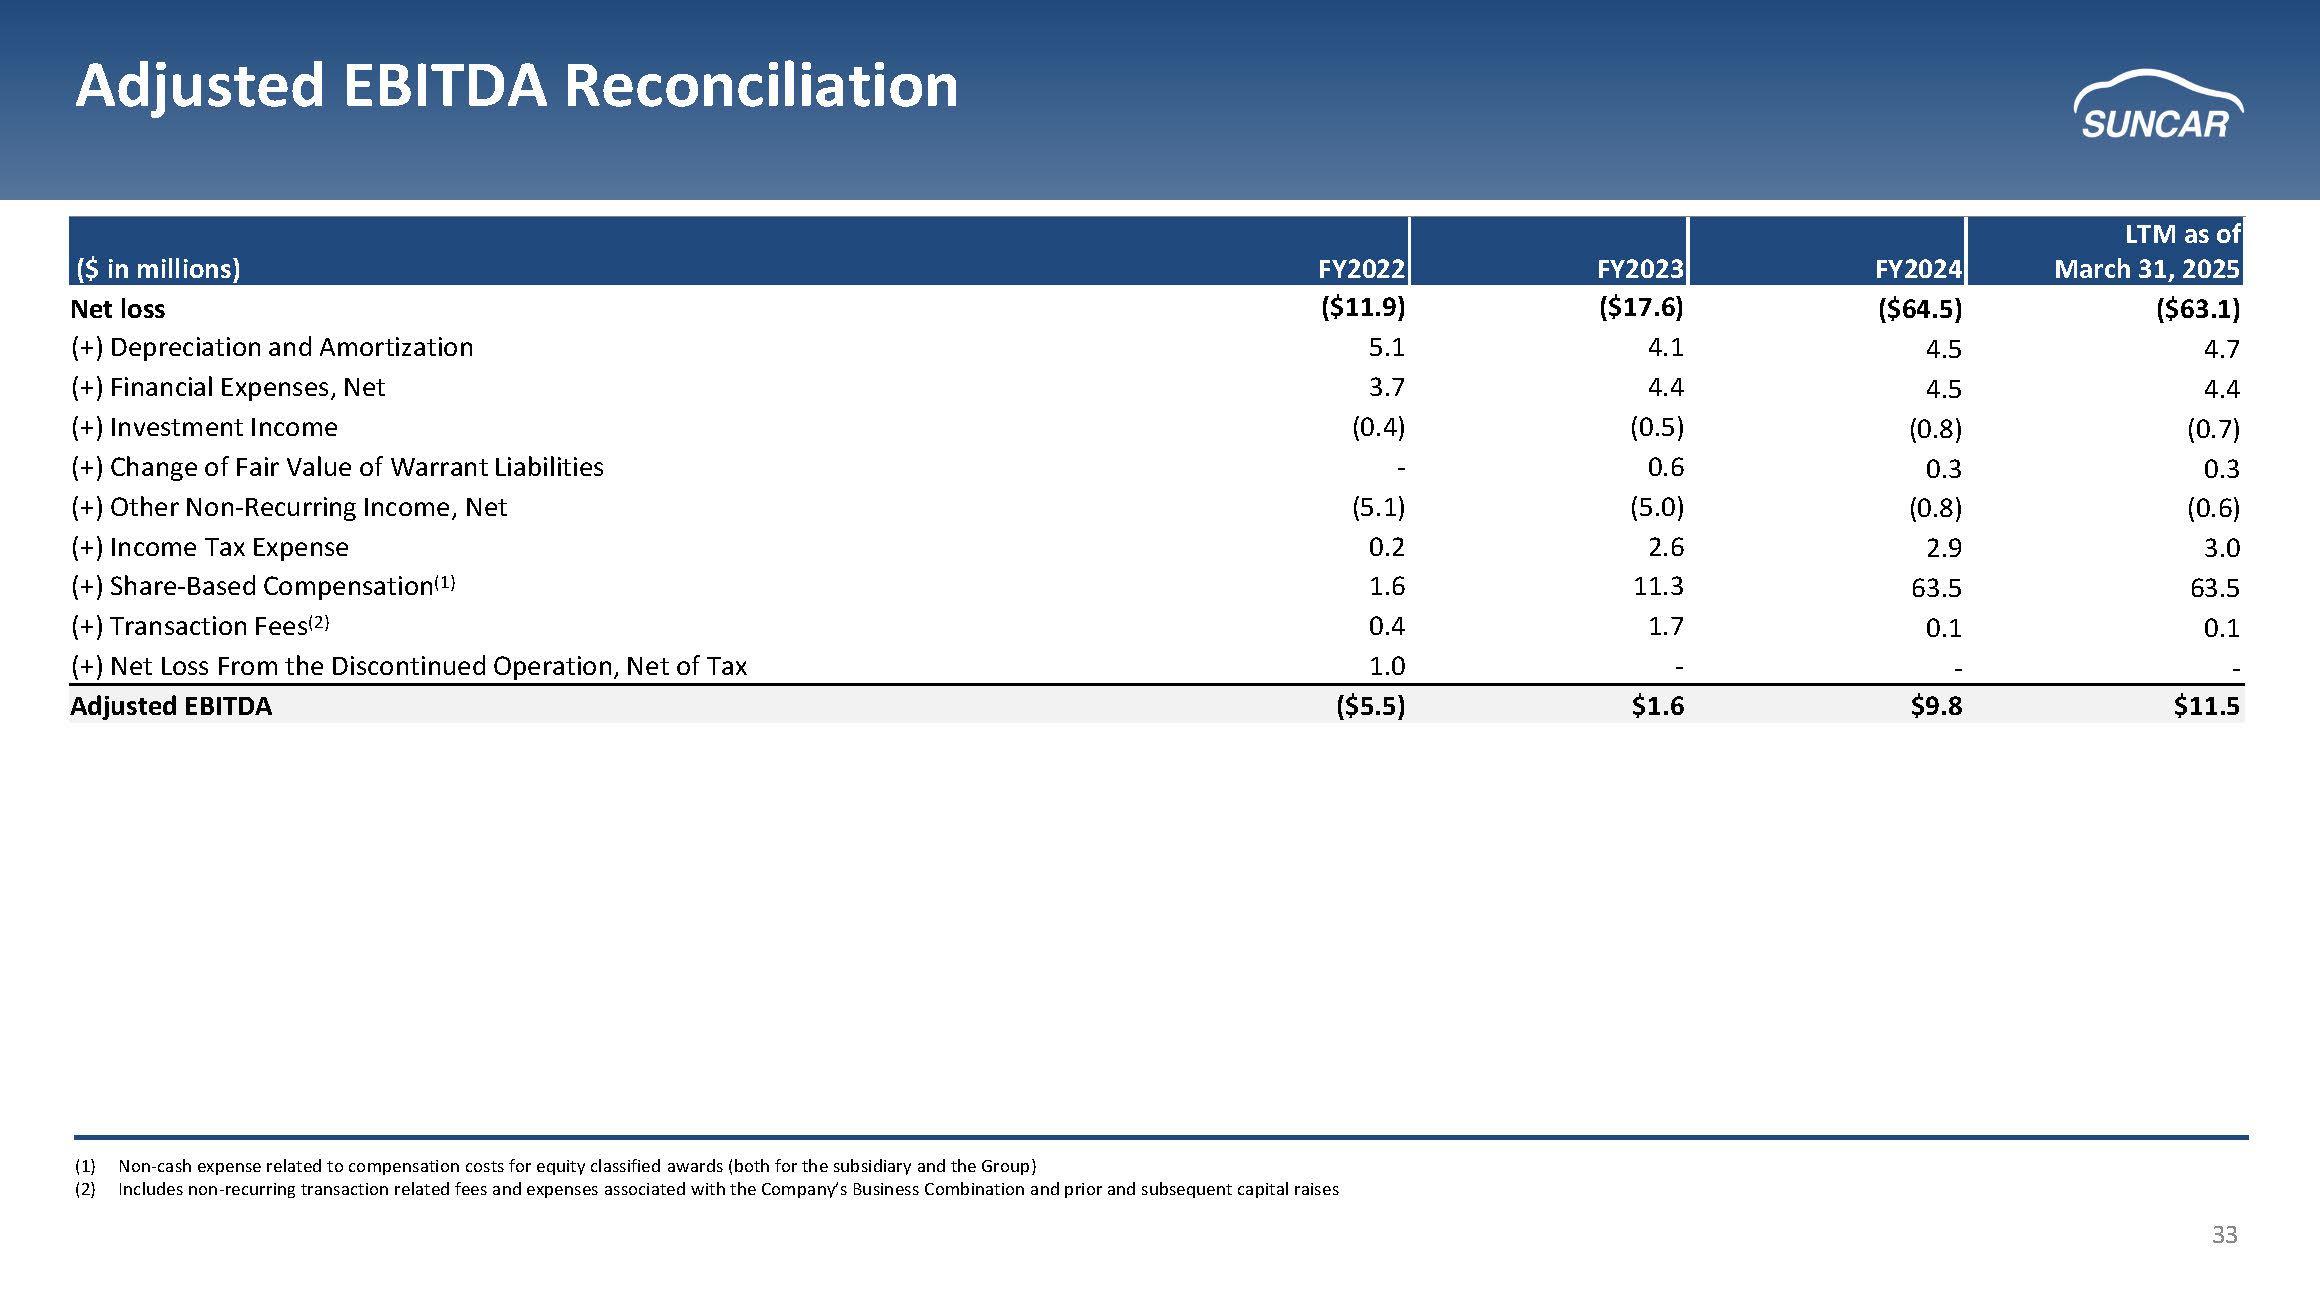
33 Adjusted EBITDA Reconciliation LTM as of March 31, 2025 FY2024 FY2023 FY2022 ($ in millions) ($63.1) ($64.5) ($17.6) ($11.9) Net loss 4.7 4.5 4.1 5.1 (+) Depreciation and Amortization 4.4 4.5 4.4 3.7 (+) Financial Expenses, Net (0.7) (0.8) (0.5) (0.4) (+) Investment Income 0.3 0.3 0.6 - (+) Change of Fair Value of Warrant Liabilities (0.6) (0.8) (5.0) (5.1) (+) Other Non - Recurring Income, Net 3.0 2.9 2.6 0.2 (+) Income Tax Expense 63.5 63.5 11.3 1.6 (+) Share - Based Compensation (1) 0.1 0.1 1.7 0.4 (+) Transaction Fees (2) - - - 1.0 (+) Net Loss From the Discontinued Operation, Net of Tax $11.5 $9.8 $1.6 ($5.5) Adjusted EBITDA (1) Non - cash expense related to compensation costs for equity classified awards (both for the subsidiary and the Group) (2) Includes non - recurring transaction related fees and expenses associated with the Company’s Business Combination and prior and su bsequent capital raises
34 T hank you www.SunCartech.com